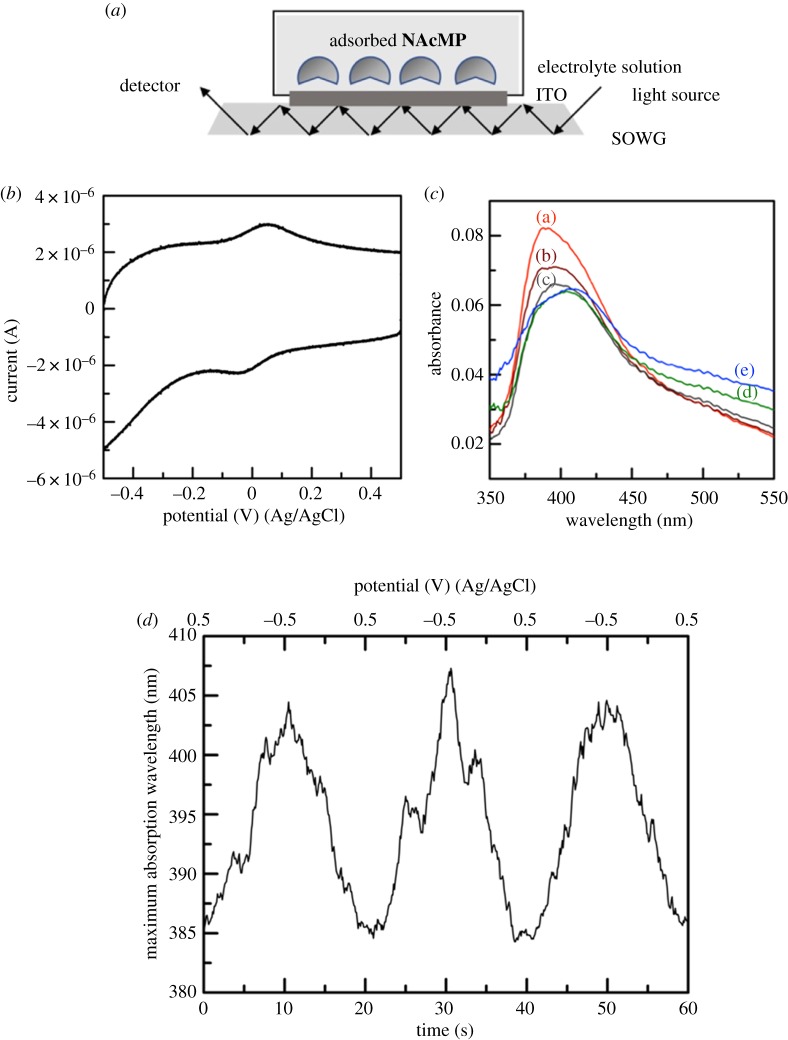
Figure 4.
Schematic illustration of spectroelectrochemical measurements using a SOWG device (a), and a representative CV for the NAcMP–ITO in 1.0 M phosphate buffer (pH 4.2) at 100 mV s−1 and 22 ± 2°C (b). The UV–visible spectra of NAcMP–ITO (c) were obtained at various potentials at +500 mV (a), +250 mV (b), 0 mV (c), –250 mV (d) and –500 mV (e), and the time course of λmax with repeated potential scanning (d).

