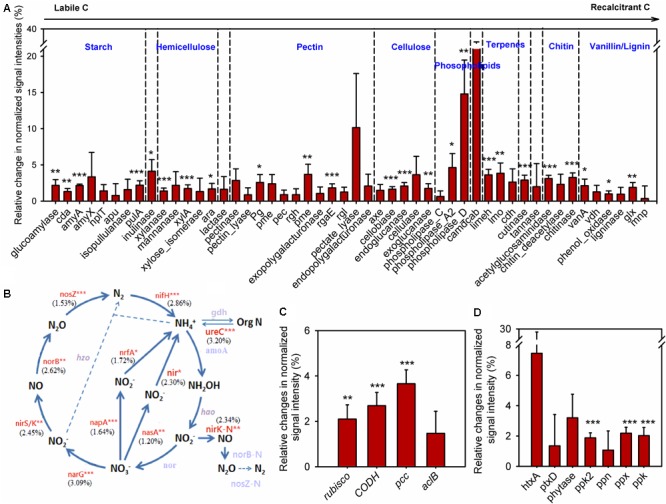
FIGURE 4.

Clipping effects on functional genes involved in biogeochemical cycling processes. (A) C degradation. The complexity of C is presented in order from labile to recalcitrant C. The average relative change of normalized signal intensity of detected genes by clipping across 5 years without 2012 samples was presented as the clipping effects on functional genes [(clipped – control)/control]. Error bars indicate standard error of the mean. Significance was tested by ANOVA as indicated by ∗∗∗P < 0.001, ∗∗P < 0.01, ∗P < 0.05. (B) N cycling processes. The percentage changes in N cycling gene abundance under clipping were indicated in parenthesis. Genes where change in abundance was significant (P < 0.05) are labeled in red. Gray-colored genes were not significantly changed under clipping. (C) C fixation. (D) P utilization genes under annual clipping. The full names of the genes in this figure are listed in Supplementary Table S4.
