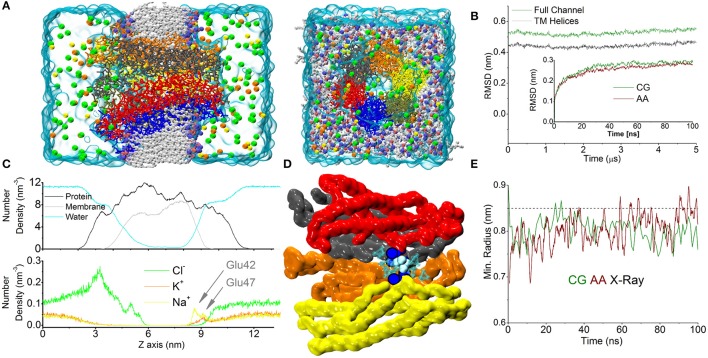
Figure 1.
CG simulation of the Cx26 unperturbed hemichannel. (A) Molecular representation of the CG Connexon showing the different constituents of the computational system on side and top (extracellular) views. Electrolytes are shown with their actual solvated size. Chloride, Sodium, and Potassium are shown in green, yellow, and orange, respectively. (B) RMSD calculated along the dynamics on the Cα positions on the full Connexon and considering only the TM helices (dark green and black, respectively). The inset shows a comparison with the same quantity calculated from an AA trajectory during the first 100 ns of simulation reported in Zonta et al. (2015). (C) Lateral density profiles of different components of the system. Protein (black), membrane (including all beads, gray), and water (cyan) are shown in the top panel, while electrolytes are shown on the bottom to facilitate the visualization. Arrows indicate the cation's peaks in the density profile corresponding to the position of Glu42 and 47. (D) The point of maximum constriction is found at the level of Lys41 (blue spheres), consistently with the AA simulation. In this point a single coarse-grained molecule can be accommodated (cyan spheres). (E) Plot of minimum radius vs. time at the level of the Lys41 in the first 100 ns for CG and AA simulations (green and dark red traces, respectively). The dashed line corresponds to the X-ray structure.

