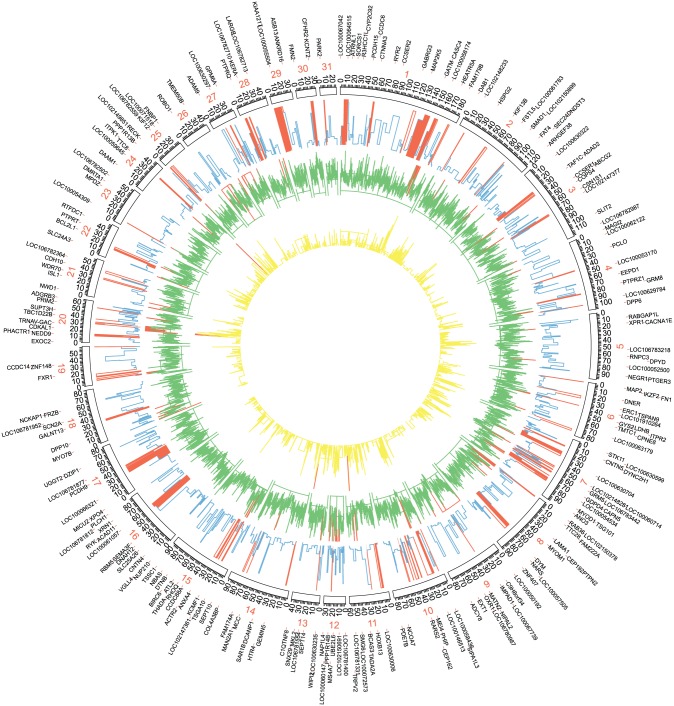
Figure 3.
Circos plot of the global distribution of genes, SNP variants, and signature of selective sweeps along the 31 autosomes. The circles, from outside to inside, illustrate gene density (yellow), SNP density (green), and CLR values (blue). The genes located in regions with significant strong sweep signatures are presented as outliers. High values in each layout (gene density: number per 100 kB; SNP density: number per 200 kB, and CLR value >15) are marked in red. CLR indicates composite likelihood ratio; SNP, single-nucleotide polymorphism.

