
FIG 6 .
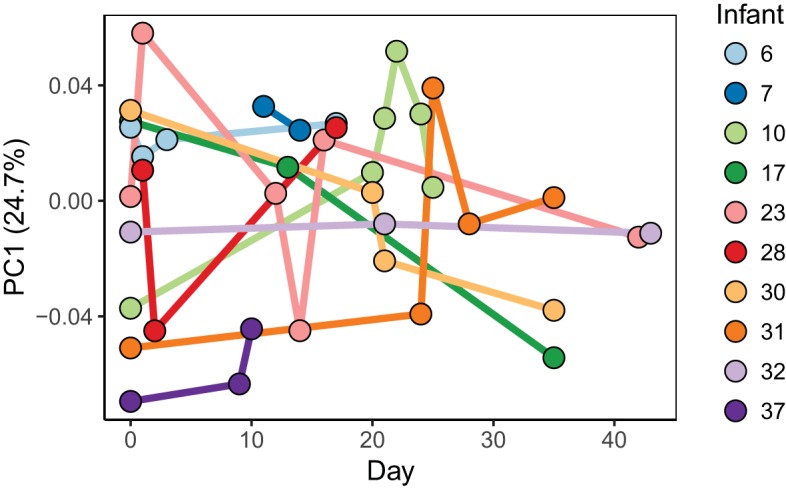
First component of PCoA of the metabolite profile over time. Manhattan distances between samples were calculated and visualized by PCoA. The first principal component which explains the most variation among the samples is shown over time. Each dot represents a single fecal sample and is colored by infant. Lines connect samples for each infant to show change over time. The results shown are only for infants with three or more longitudinal samples.