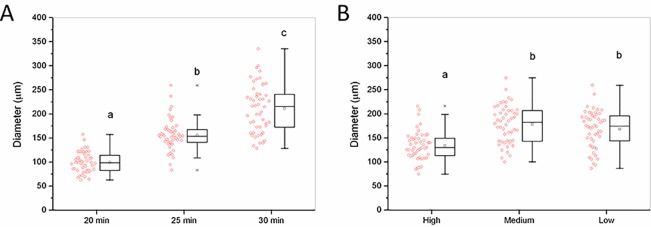
Figure 2.
gLAMP optimization. Effect of (A) reaction time and (B) template concentration on the size of QUASR gLAMP amplicon dots. Box plots with the original data of the amplicon dot diameters on the left side. Different letters indicate significant differences at the p < 0.05 level according to one-way ANOVA followed by a Tukey’s post-hoc test. Template concentration definition: low, 1–20 copies per reaction; medium, 20–200 copies per reaction; and high, 200–2000 copies per reaction. A medium template concentration was used in panel A, while the reaction time shown in panel B was 25 min. Extracted MS2 RNA was used as templates.

