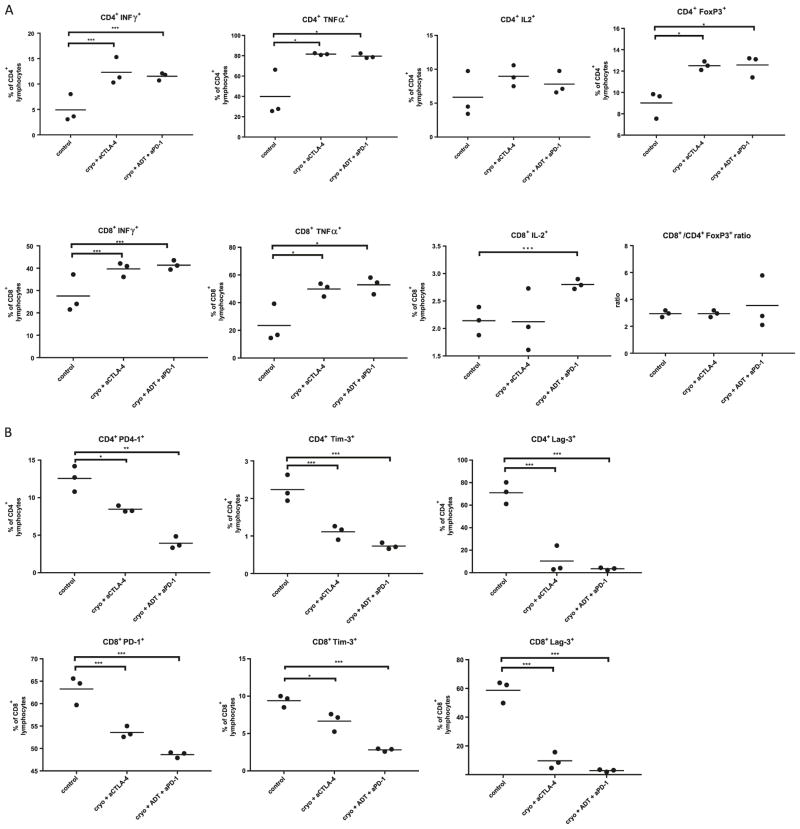
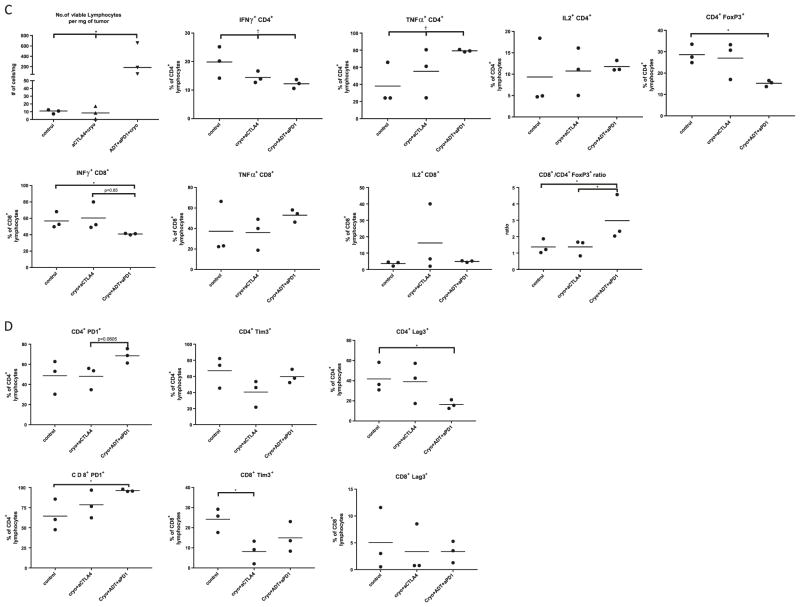
Fig. 4.
Characterization of immune response in most effective treatment groups. a Cytokine profile of CD4+ and CD8+ lymphocytes in spleen. b Expression of immune check point molecules on CD4+ and CD8+ lymphocytes in spleen. c Cytokine profile of CD4+ and CD8+ tumor infiltrating lymphocytes. d Expression of immune checkpoint molecules on tumor infiltrating lymphocytes. Data are presented as scatter plots with mean, each data point represents a sample made by combining 2 mice from same treatment group, means were compared by t test, significance of linear trend between means and treatment groups was tested by test for linear trend. *p < 0.05,**p < 0.01, ***p < 0.001 for t test. †p < 0.05, ††p < 0.01, †††p < 0.001, for test for linear trend


