Figure 2.
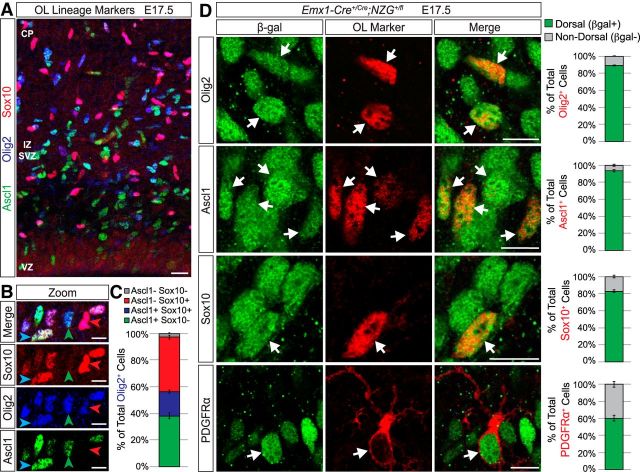
Most neocortical oligodendrocyte-lineage cells in different stages of maturation are dorsally derived at E17.5. A, Representative image of Ascl1 (green), Olig2 (blue), and Sox10 (red) expression in the presumptive somatosensory cortex at E17.5. Scale bar, 20 μm. B, Higher-magnification examples of Olig2+ cells that are Ascl1+Sox10+ (blue arrow), Ascl1+Sox10− (green arrow), and Ascl1−Sox10+ (red arrow). Scale bar, 10 μm. C, Graph of the average (±SEM among biological replicates) percentage of Olig2+ cells in the somatosensory cortex (white matter and gray matter combined) that are Ascl1+Sox10− (green), Ascl1+Sox10+ (blue), Ascl1−Sox10+ (red), or Ascl1−Sox10− (gray). D, Representative images of oligodendrocyte lineage cell markers (red) and β-gal (green) staining in the presumptive somatosensory cortex of Emx1;NZG mice at E17.5. The majority of Olig2+, Ascl1+, Sox10+, and PDGFRα+ cells were β-gal+ (white arrows). Graphs at right represent the average (±SEM among biological replicates) percentage of Olig2+, Ascl1+, Sox10+, or PDGFRα+ cells in the somatosensory cortex (white matter and gray matter combined) that were dorsally derived (β-gal+) versus not dorsally derived (β-gal−). OL, oligodendrocyte; CP, cortical plate; IZ, intermediate zone; SVZ, subventricular zone; VZ, ventricular zone. Scale bar, 10 μm.

