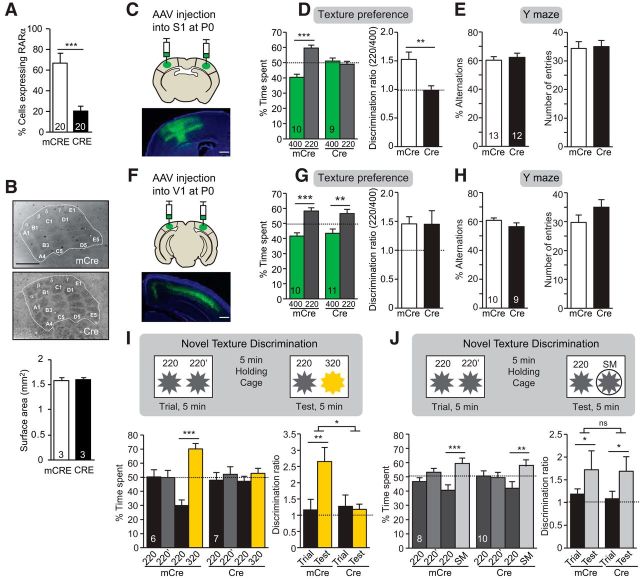
Figure 3.
Specific role of RARα in barrel cortex in texture preference and novel texture discrimination. A, Quantification of percentage of L5 PN expressing RARα mRNA measured by single-cell RT-qPCR of P30 WT and S1-RARα cKO mice (***p < 0.001, one-way ANOVA; n = the number of cells used from 3 mice per genotype). B, Representative images of P30 WT (mCRE) and S1-RARα cKO (CRE) cortices visualized by cytochrome c staining in tangential sections and quantification of S1 surface area outlined in images. Scale bar, 500 μm. C, Representative image of stereotaxic injection into S1 of RARαfl/fl mice of AAV virus expressing synapsin promoter driven active Cre or inactive mCRE. Scale bar, 500 μm. D, Quantification of texture preference in S1-RARα cKO mice. Bar graphs show percentage of time spent at texture 400 and 220 (left; ***p < 0.001, one-way ANOVA) and discrimination ratios of the two textures of S1-RARα cKO mice (right; **p < 0.01, one-way ANOVA). E, Quantification of Y-maze test in S1-RARα cKO mice. Bar graphs show quantification of percentage of alternation (left) and number of entries (right). F, Representative image of stereotaxic Cre or mCre injection into V1 of RARαfl/fl mice. Scale bar, 500 μm. G, Quantification of texture preference in V1-RARα cKO mice. Bar graphs show percentage of time spent at texture 400 and 220 (left; **p < 0.01, ***p < 0.001, one-way ANOVA) and discrimination ratios of the two textures of V1-RARα cKO mice (right). H, Quantification of Y-maze test in V1-RARα cKO mice. Bar graphs show quantification of percentage of alternation (left) and number of entries (right). I, J, Schematics (top) and quantification (bottom) of novel texture discrimination in S1-RARα cKO mice with two different texture pairs. Bar graphs show percentage of time spent at each texture during the trial and test phase (bottom left; **p < 0.01, ***p < 0.001, one-way ANOVA) and discrimination ratios between the two textures during the corresponding phase (right; *p < 0.05, **p < 0.01, two-way ANOVA). In all graphs, data represent mean values ± SEM, and n represents the number of animals used for each condition unless otherwise stated.

