Figure 4.
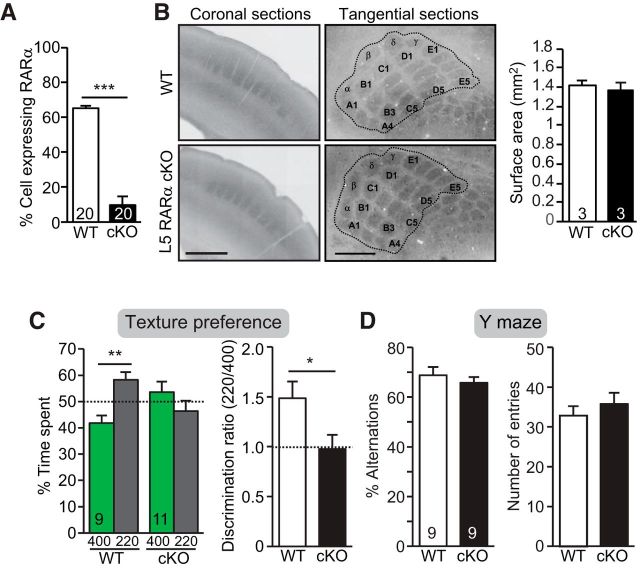
Deletion of RARα expression in L5 PNs altered texture preference. A, Quantification of percentage of L5 PN expressing RARα mRNA measured by single-cell RT-qPCR of P30 WT and L5-RARα cKO mice (***p < 0.001; n = the number of cells used from 3 mice per genotype). B, Representative images of intact barrel formation of L5 PN-RARα cKO mice in coronal and tangential sections and quantification of S1 surface area outlined in images. Scale bar, 500 μm. C, Quantification of texture preference in L5 PN-RARα cKO mice. Bar graphs show percentage of time spent at texture 400 and 220 (left; **p < 0.01) and discrimination ratios of the two textures (right; *p < 0.05). D, Quantification of Y-maze performance in L5 PN-RARα cKO mice. Bar graphs show percentage of alternation (left) and quantification of number of entries (right). In all graphs, data represent average mean ± SEM; n indicates the numbers of mice analyzed. Statistical significance was determined using one-way ANOVA.

