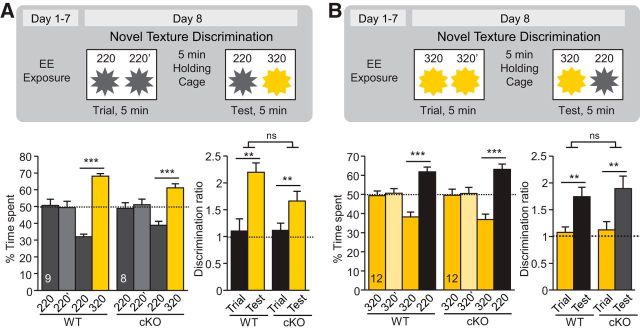
Figure 6.
Effects of enriched environment on novel texture discrimination in CaMKIIα-RARα cKO mice. A, B Schematics (top) and quantification (bottom) of novel texture discrimination between 220/320 pairs (A) and 320/220 pairs (B). Bar graphs show percentage of time spent at each texture during the trial and test phases (bottom left; ***p < 0.001, one-way ANOVA) and discrimination ratios between the texture pairs during the trial and test phases (bottom right; **p < 0.01, two-way ANOVA). In all graphs, data represent mean values ± SEM; n indicates the numbers of mice analyzed.

