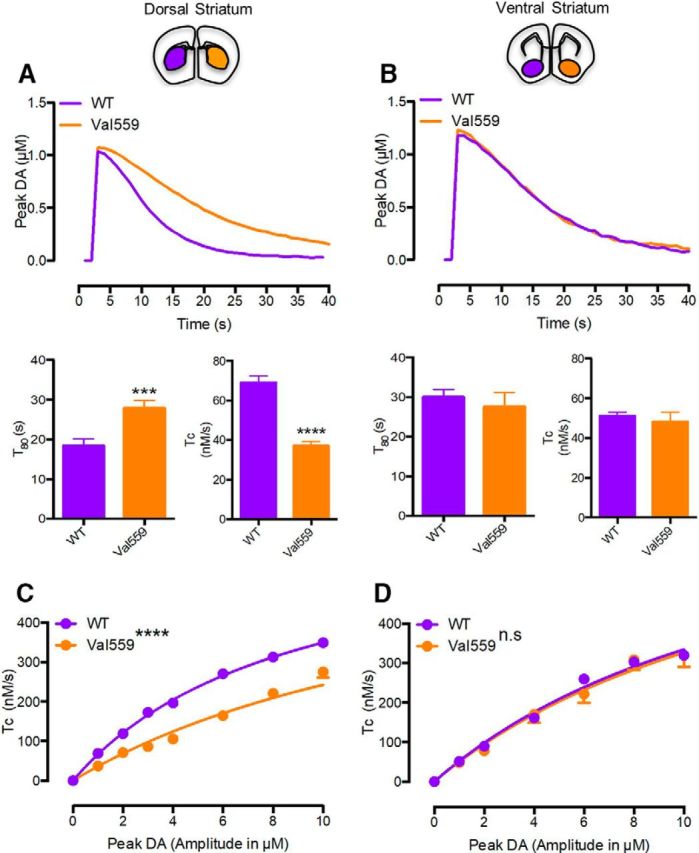
Figure 3.

Val559 reduces in vivo clearance of exogenous DA, highlighting impact of ADE in the DS, not VS. In the DS, (A) Val559 expression results in decreased TC (two-tailed Student's t test, t(30) = 8.499, p < 0.0001, N = 5–6) and a delay in T80 (two-tailed Student's t test, t(30) = 3.661, p = 0.001, N = 5–6), also apparent in the representative clearance trace at 1 μm, but in the VS (B) causes no change in TC (two-tailed Student's t test, t(22) = 0.549, p = 0.568, N = 4) or T80 (two-tailed Student's t test, t(22) = 0.400, p = 0.693, N = 4). In dose-dependent studies in the DS, (C) clearance rates (TC) are attenuated in the Val559 compared with the WT (two-way ANOVA, genotype: F(1,218) = 401.8, p < 0.0001; peak DA: F(7,218) = 506.7, p < 0.0001; interaction: F(7,218) = 18.33, p < 0.0001. Bonferroni's multiple-comparisons test shows p = 0.002 for WT vs Val559 at 1 μm and p < 0.0001 at 2, 3, 4, 6, 8, and 10 μm peak DA, N = 5–6). TC profiles conformed to Michaelis–Menten kinetics in both WT and Val559 (WT-r2 = 0.969, Val559-r2 = 0.873), but show apparent KM for DA being significantly higher in Val559 (WT KM = 8.9 ± 0.14 μm, Val559 KM = 17.3 ± 0.50 μm, two-tailed Student's t test, t(9) = 14.49, p < 0.0001). In the VS, (D) Val559 TC is comparable to WT over all DA signal amplitudes (two-way ANOVA, genotype: F(1,154) = 0.561, p = 0.478; peak DA: F(6,154) = 162.2, p < 0.0001; interaction: F(6,154) = 0.619, p = 0.715, N = 4) and conformed well to Michaelis–Menten kinetics for WT and Val559 (WT-r2 = 0.971, Val559-r2 = 0.861), with no change in apparent KM (WT KM = 14.99 ± 0.24 μm, Val559 KM = 15.59 ± 0.82 μm, two-tailed Student's t test, t(6) = 0.7, p =0.528). * denotes comparisons across genotypes (WT vs. Val559); denotes comparisons across genotypes (WT vs. Val559); ***p < 0.001 for T80 comparisons and ****p < 0.0001 for TC comparisons in (A), and ****p < 0.0001 for TC comparisons in (C).
