
Figure 2.
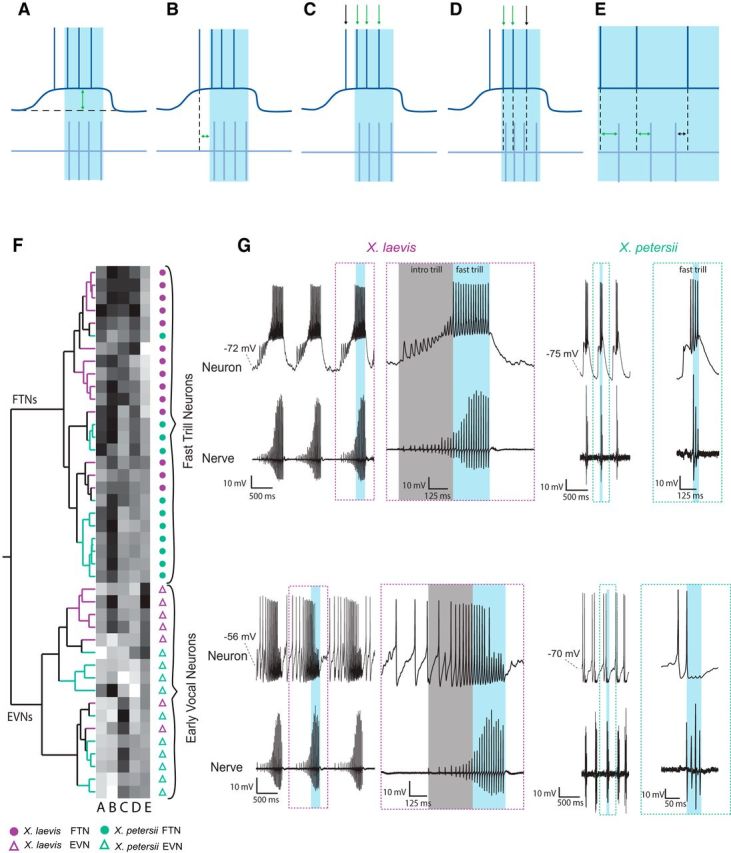
Two populations of premotor vocal cells in PBX. A–E, Schematics representing temporal characteristics of premotor vocal neuron activity (top traces, dark blue lines) relative to fictive fast trill (bottom traces, light blue lines) included in Ward's hierarchical clustering and PCA: the maximum depolarization during fast trill (A, arrow), the time between fast trill onset and the first spike in each burst of premotor firing (B, arrow), the percentage of spikes during fast trill (C, green arrows) as opposed to shortly before or after fast trill (C, black arrow), the percentage of spikes that preceded the nearest CAP (D, green arrows), and the times between each spike peak and the nearest CAP peak (positive times: E, green arrows; negative times: black arrow). F, Ward's hierarchical clustering separates cells into two populations in both species. G, FTNs tend to spike during fast trill (blue box), whereas EVNs tend to begin spiking before fast trill onset; in X. laevis, this occurs during introductory trill (gray box). Dashed boxes depict temporally expanded recordings of single calls for each cell type.