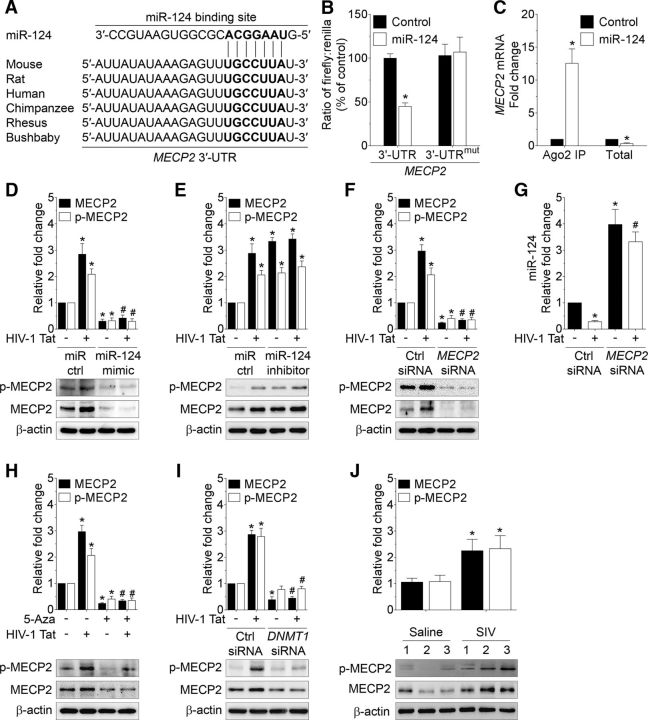
Figure 5.
HIV-1 Tat-mediated downregulation of miR-124 targets MECP2. A, Putative miR-124 binding sites in MECP2 gene. B, Relative luciferase activity of MECP2 3′-UTR as well as MECP2 3′-UTRmut plasmid cotransfected with miR-124 mimic and inhibitor in mouse primary microglial cells. C, Ago2 IP confirmed the enrichment of the miR-124 target mRNA, MECP2 in Ago2 IP compared with total RNA isolated from mouse primary microglial cells transfected with miR-124 mimic and control. D, Representative Western blots showing the protein levels of both p-MECP2 (Ser 80) and MECP2 in mouse primary microglial cells transfected with control and miR-124 mimic following exposure to HIV-1 Tat (50 ng/ml) for 24 h. E, Representative Western blots showing the protein levels of both p-MECP2 (Ser 80) and MECP2 in mouse primary microglial cells transfected with control and miR-124 inhibitor following exposure to HIV-1 Tat (50 ng/ml) for 24 h. F, Representative Western blots showing the protein levels of both p-MECP2 (Ser 80) and MECP2, and (G) qPCR analysis of miR-124 in mouse primary microglial cells transfected with scrambled and MECP2 siRNA following exposure to HIV-1 Tat (50 ng/ml) for 24 h. Representative Western blots showing the protein levels of both p-MECP2 (Ser 80) and MECP2 in mouse primary microglial cells either pretreated with 5-Aza (H) or transfected with scrambled and DNMT1 siRNA (I) following exposure to HIV-1 Tat (50 ng/ml) for 24 h. Data are mean ± SEM from six independent experiments. Nonparametric Kruskal–Wallis one-way ANOVA followed by Dunn's post hoc test was used to determine the statistical significance between multiple groups. *p < 0.05 versus control. #p < 0.05 versus HIV-1 Tat. J, Representative Western blots showing the increased levels of both p-MECP2 (Ser 80) and MECP2 in the basal ganglia of SIV-infected rhesus macaques compared with the saline group. β-Actin was probed as a protein loading control for all the experiments. Data are mean ± SEM. An unpaired Student's t test was used to determine the statistical significance. *p < 0.05 versus saline. −, Vehicle treatment (i.e., 1 μl 1 × PBS/ml of medium).

