Figure 8.

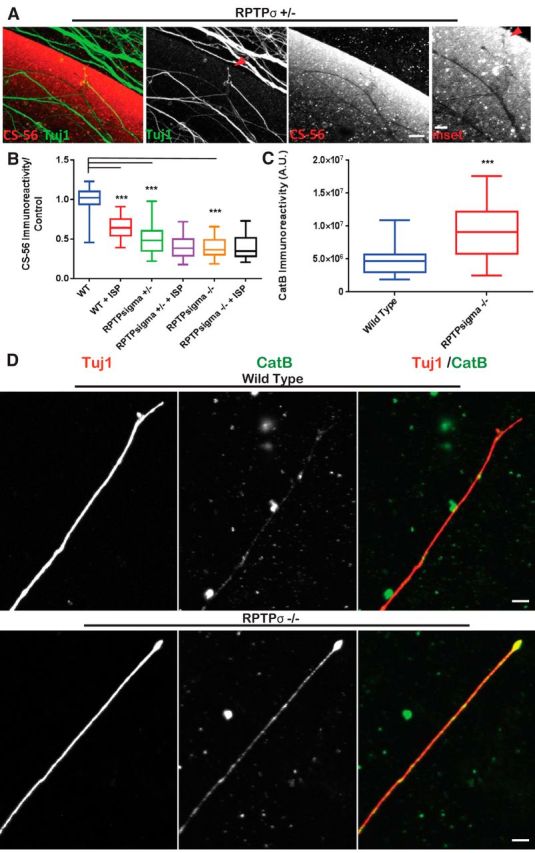
Genetic loss of RPTPσ correlates with CatB activity and CSPG degradation. A, DRGs extracted from RPTPσ+/− animals were cultured on aggrecan spot stained with CS-56 and Tuj1 display digest trails. Arrows point to digested CS-56 left by axon tip. Scale bar, 50 μm. B, CM harvested from BALB/C WT or RPTPσ+/− or −/− animals treated with vehicle or 2.5 μm ISP were incubated onto new aggrecan spots and stained with CS-56 before quantification: n = 100, 56, 51, 32, 63, 64; F(7,52) = 71.6, WT vs ISP, p = 0.0001; WT vs +/−, p = 0.0001; WT vs −/−, p = 0.0001 (ANOVA). C, D, Representative images of CatB in BALB/C WT and RPTPσ−/− DRGs (Tuj1). Scale bar, 20 μm. Quantification of CatB immunoreactivity: n = 45, 30; t = 3.843, df = 30, p = 0.0006 (unpaired t test). Lines indicate median. Boxes represent quartiles. Whiskers indicate range. ***p < 0.001.
