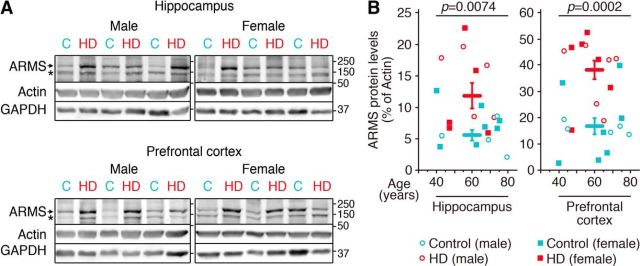
Figure 5.
HD patients have increased ARMS levels. A, Representative Western blot showing ARMS protein expression. Actin and GAPDH were used as loading controls. C, Control sample; HD, HD sample. B, Quantification of ARMS levels in the hippocampus and PFC of patients with HD (for hippocampus, n = 4, n = 7, n = 5, and n = 5 for male and female controls and male and female patients with HD, respectively; for PFC, n = 5, n = 7, n = 6, and n = 6 for male and female controls and male and female patients with HD, respectively). Unpaired Student's t test, mean ± SEM. Control versus HD patients: hippocampus, t = 2.998, df = 19; PFC, t = 4.510, df = 22. * = nonspecific band.

