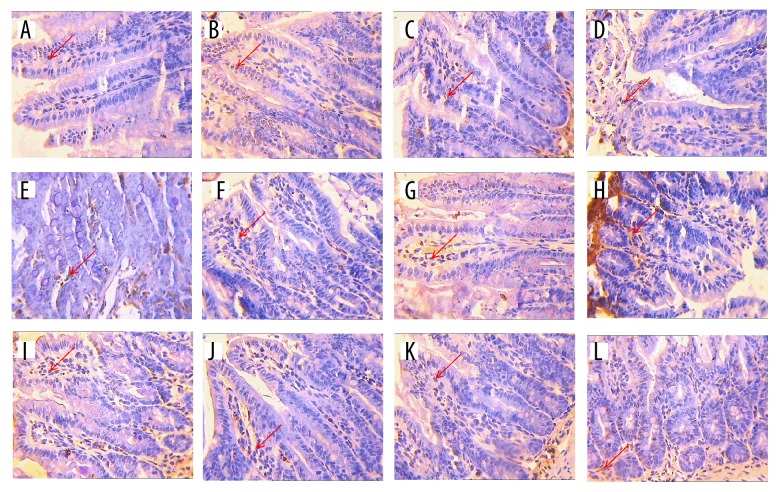
Figure 2.
The apoptosis appearance of ETEC-induced ileum tissues treated by magnolol and honokiol in mice of different experimental groups (n=5, ×400). DNA fragmentation was examined by terminal deoxynucleotidyl transferase mediated dUTP nick-end labeling staining. (A) Shows the apoptosis appearance of the normal control mice. (B) Shows the apoptosis appearance of ETEC-induced mice. (C) Shows the apoptosis appearance of loperamide hydrochloride-treated ETEC-induced mice. (D–L) Shows the apoptosis appearance of magnolol and honokiol administration at 100 mg/kg BW (M100) ×100 mg/kg BW (H100), M100×H300, M100×H500, M300×H100, M300×H300, M300×H500, M500×H100, M500×H300, and M500×H500 treated ETEC-induced mice.

