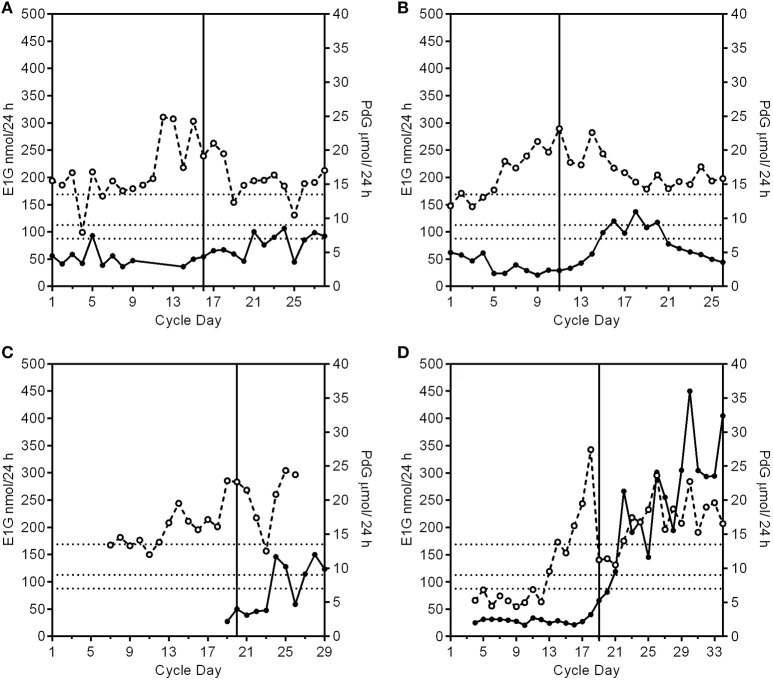
Figure 2.
Patterns of PdG production and deficient cycle types. The PdG thresholds 7, 9, and 13.5 μmol/24 h are shown as broken horizontal lines. The vertical line is the day of the LH peak. (A) A profile of a cycle with a luteinized unruptured follicle where the E1G excretion rates (°) fluctuate and the PdG excretion rates (•) exceed 7 μmol/24 h, but not 9 μmol/24 h. (B) A profile of a cycle with a deficient luteal phase where the E1G excretion rates fluctuate and the PdG excretion rates exceed 9 μmol/24 h, but not 13.5 μmol/24 h. (C). A profile of a cycle with a short and deficient luteal phase. The E1G excretion rates fluctuate and there is an early E1G peak on day 14. The luteal phase was 9 days counted from the peak E1G excretion rate day (day 20) to the day before the next bleed making it a short luteal phase and it was also a deficient luteal phase as defined in (B) where the PdG excretion rates exceed 9 μmol/24 h, but not 13.5 μmol/24 h. (D) A pregnancy cycle with a classical single E1G rate peak profile in the follicular phase and in which the PdG excretion rates exceed all the thresholds, but the rate has not decreased after 17 days from the E1G peak day.

