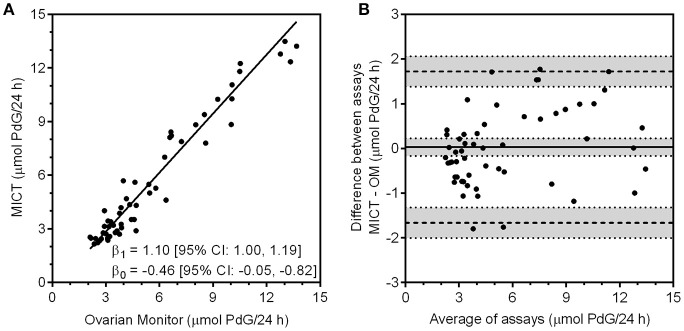
Figure 4.
(A) Correlation of the PdG values obtained with the MICT PdG assay vs. the excretion rates obtained for the same urine samples with the Ovarian Monitor PdG assay. The upper and lower limits of quantitation were calculated for both assays and only data that were within the range for each assay were correlated. The line shown was obtained by Deming regression. (B) The Bland-Altman plot of the data is shown where the difference between the two assays (MICT—OM) is calculated and plotted against the mean of the two values. (68).

