Figure 4.

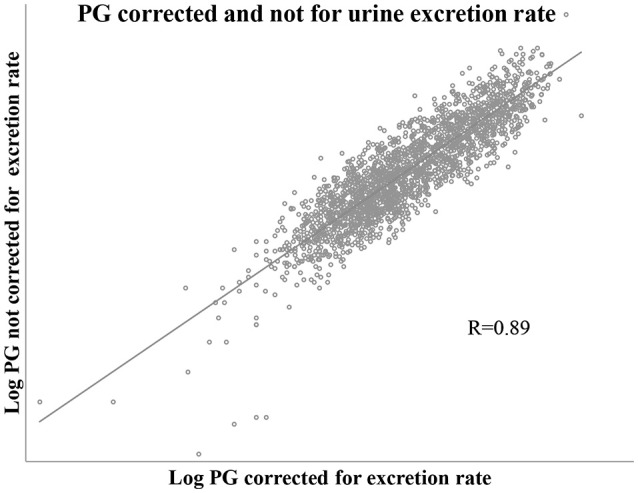
Scatter plot showing correlation of PG values corrected and not corrected for urine excretion rate. Includes one pair of PG values for each of all study cycle days, n = 2,131 pair of values.

Scatter plot showing correlation of PG values corrected and not corrected for urine excretion rate. Includes one pair of PG values for each of all study cycle days, n = 2,131 pair of values.