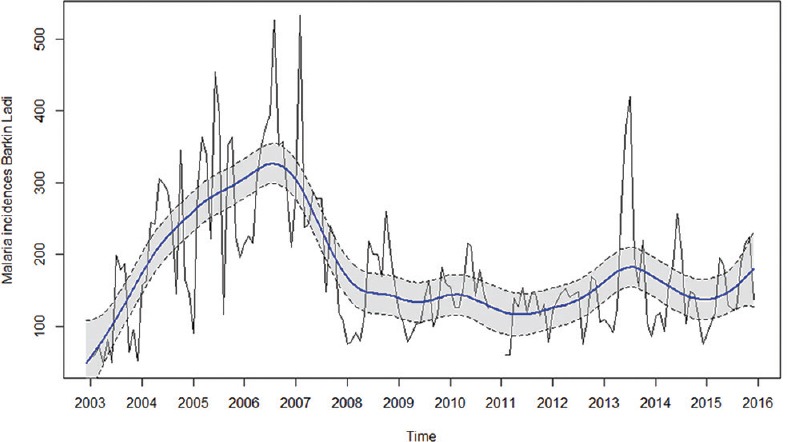
Figure 4.

Malaria trend for Barkin Ladi local government area from 2003 to 2015. Blue line is smoothed trend. Dashed black lines are 95% confidence intervals. Black line is regular peaks and drops

Malaria trend for Barkin Ladi local government area from 2003 to 2015. Blue line is smoothed trend. Dashed black lines are 95% confidence intervals. Black line is regular peaks and drops