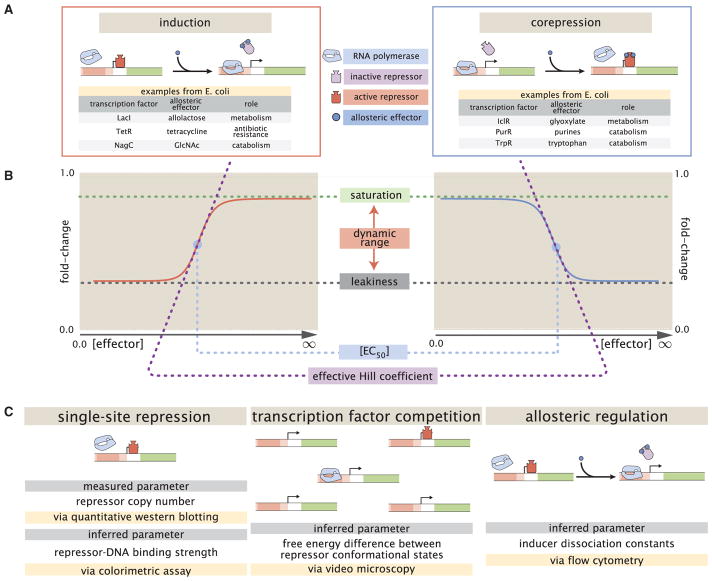
Figure 1. Transcription Regulation Architectures Involving an Allosteric Repressor.
(A) We consider a promoter regulated solely by an allosteric repressor. When bound, the repressor prevents RNAP from binding and initiating transcription. Induction is characterized by the addition of an effector that binds to the repressor and stabilizes the inactive state (defined as the state with a low affinity for DNA), thereby increasing gene expression. In corepression, the effector stabilizes the repressor’s active state and thus further reduces gene expression. We list several characterized examples of induction and corepression that support different physiological roles in E. coli (Huang et al., 2011; Li et al., 2014).
(B) A schematic regulatory response of the two architectures shown in (A) plotting the fold-change in gene expression as a function of effector concentration, where fold-change is defined as the ratio of gene expression in the presence versus the absence of repressor. We consider the following key phenotypic properties that describe each response curve: the minimum response (leakiness), the maximum response (saturation), the difference between the maximum and minimum response (dynamic range), the concentration of ligand that generates a fold-change halfway between the minimal and maximal response ([EC50]), and the log-log slope at the midpoint of the response (effective Hill coefficient).
(C) Over time, we have refined our understanding of simple repression architectures. A first round of experiments used colorimetric assays and quantitative western blots to investigate how single-site repression is modified by the repressor copy number and repressor-DNA binding energy (Garcia and Phillips, 2011). A second round of experiments used video microscopy to probe how the copy number of the promoter and presence of competing repressor binding sites affect gene expression, and we use this dataset to determine the free energy difference between the repressor’s inactive and active conformations (Weinert et al., 2014). Here we used flow cytometry to determine the inducer-repressor dissociation constants and demonstrate that with these parameters we can predict a priori the behavior of the system for any repressor copy number, DNA binding energy, gene copy number, and inducer concentration.

