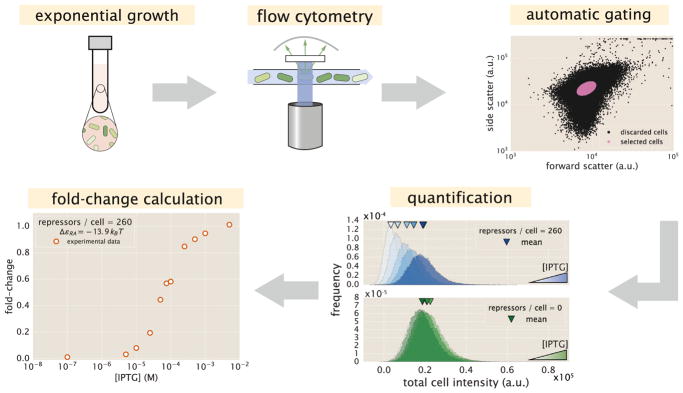
Figure 3. An Experimental Pipeline for High-Throughput Fold-Change Measurements.
Cells are grown to exponential steady state and their fluorescence is measured using flow cytometry. Automatic gating methods using forward- and side-scattering are used to ensure that all measurements come from single cells (see STAR Methods). Mean expression is then quantified at different IPTG concentrations (top, blue histograms) and for a strain without repressor (bottom, green histograms), which shows no response to IPTG as expected. Fold-change is computed by dividing the mean fluorescence in the presence of repressor by the mean fluorescence in the absence of repressor.

