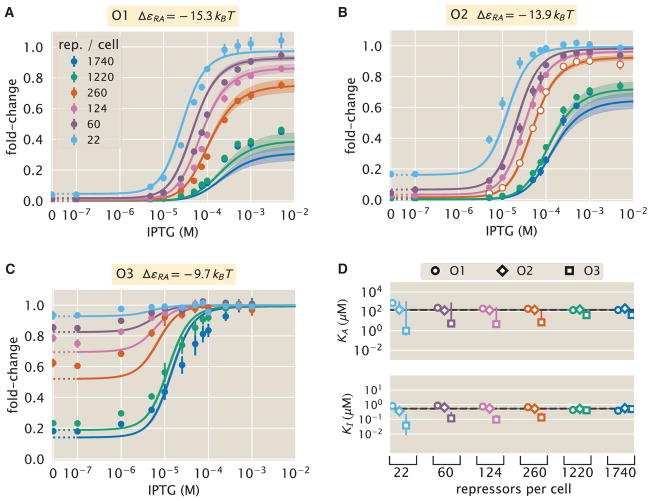
Figure 5. Comparison of Predictions against Measured and Inferred Data.
(A–C) Flow-cytometry measurements of fold-change over a range of IPTG concentrations for (A) O1, (B) O2, and (C) O3 strains at varying repressor copy numbers, overlaid on the predicted responses. Error bars for the experimental data show the SEM (eight or more replicates). As discussed in Figure 4, all of the predicted induction curves were generated prior to measurement by inferring the MWC parameters using a single dataset (the O2 strain with R = 260, shown by white circles in B). The predictions may therefore depend upon which strain is used to infer the parameters.
(D) The inferred parameter values of the dissociation constants KA and KI using any of the 18 strains instead of the O2 strain with R = 260. Nearly identical parameter values are inferred from each strain, demonstrating that the same set of induction profiles would have been predicted regardless of which strain was chosen. The points show the mode, and the error bars denote the 95% credible region of the parameter value distribution. Error bars not visible are smaller than the size of the marker.

