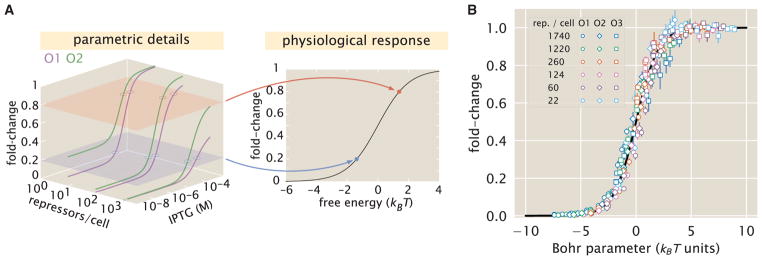
Figure 7. Fold-Change Data from a Broad Collection of Different Strains Collapse onto a Single Master Curve.
(A) Any combination of parameters can be mapped to a single physiological response (i.e., fold-change) via the free energy, which encompasses the parametric details of the model.
(B) Experimental data from Figure 5 collapse onto a single master curve as a function of the free energy Equation 12. The free energy for each strain was calculated from Equation 12 using n = 2, ΔεAI = 4.5 kBT, KA = 139 × 10−6 M, KI = 0.53 × 10⁻⁶ M, and the strain-specific R and ΔεRA. All data points represent the mean, and error bars are the SEM for eight or more replicates.

