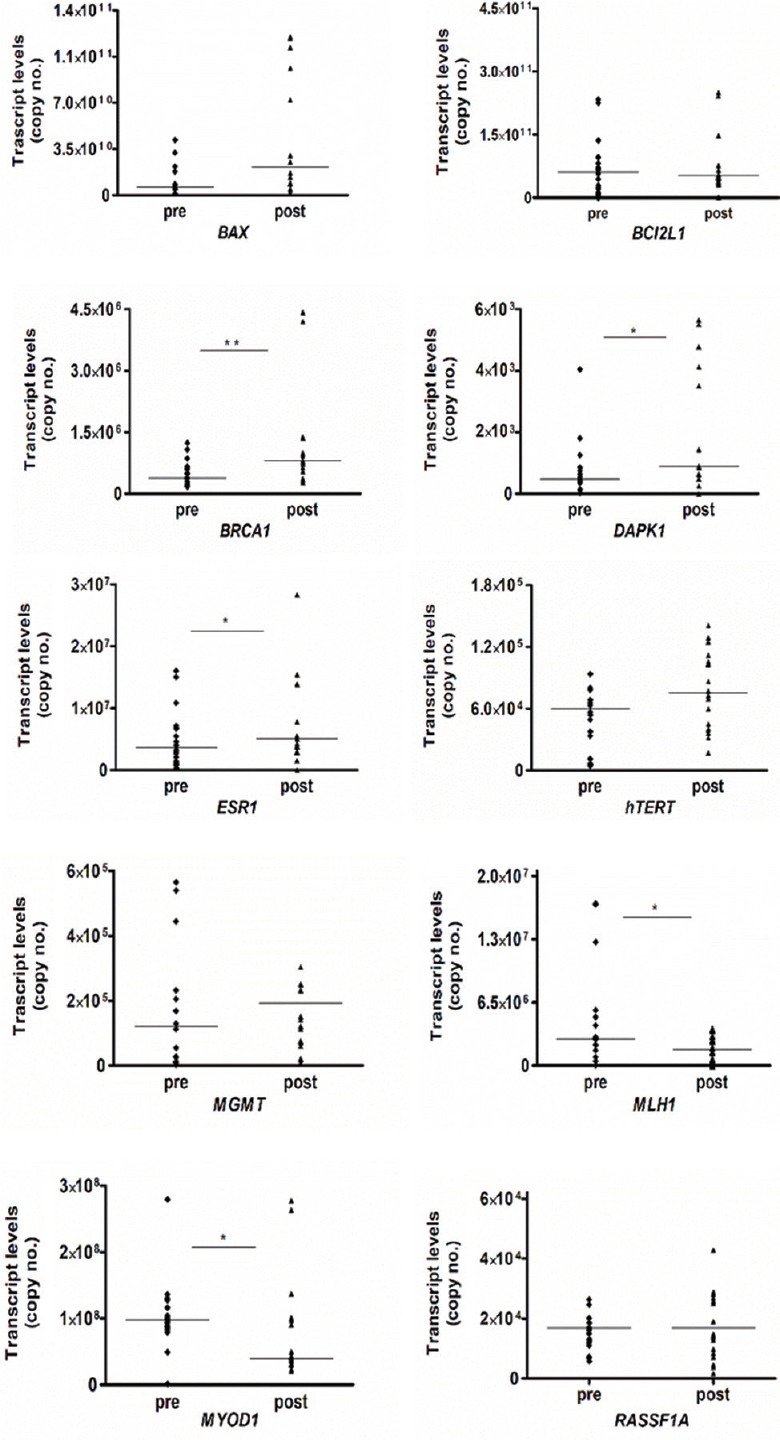
Fig. 2.

Dot plot showing comparison of transcript levels (copy number) in paired pre- and post-chemoradiation therapy samples of invasive cervical cancer. Median values are shown as horizontal bars (n=20). P *<0.05, **<0.01 compared to respective pre values.
