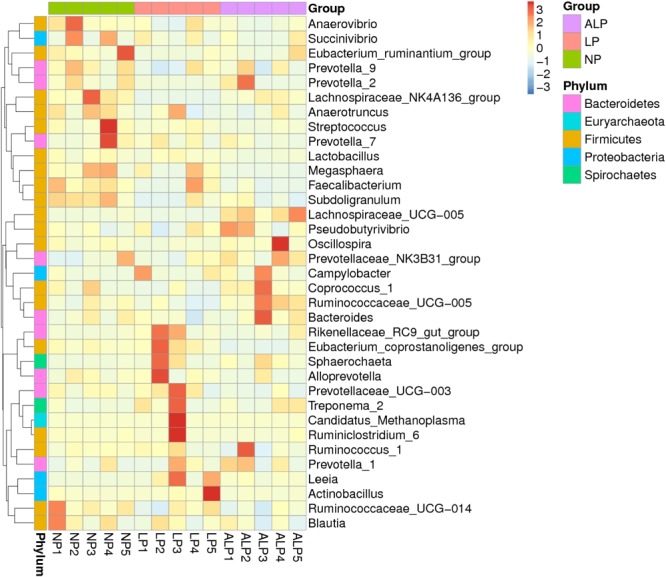
FIGURE 4.

Heatmap based on hierarchical clustering solution (Bray–Curtis distance metric and complete clustering method) for 15 pigs fed three different diets, shown across columns. Rows represent top 35 microbial genera. NP, normal protein; LP, low protein; ALP, AKG plus low protein.
