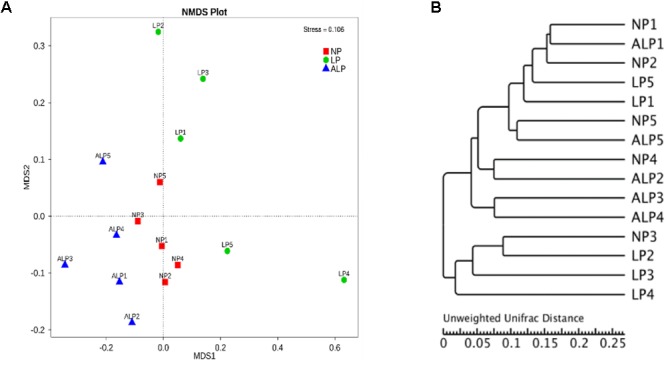
FIGURE 6.

Comparison of cecal microbial community structures within growing pigs fed different diets. (A) Non-metric multidimensional scaling (NMDS) based on weighted UniFrac distance among samples of different treatments, based on stress < 0.2 with significantly different abundance among groups (NP, LP, and ALP), (B) UPGMA tree, all revealing significant differences among treatments based on Unweighted UniFrac distances of OTU community. NP, normal protein; LP, low protein; ALP, AKG plus low protein.
