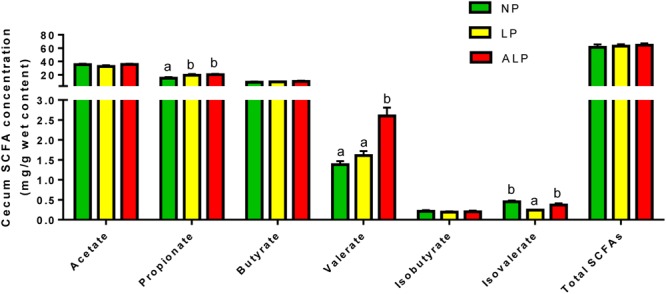
FIGURE 8.

Comparison of cecal short chain fatty acids (SCFAs) (mg/g) among dietary treatments. NP, normal protein; LP, low protein; ALP, AKG plus low protein. For each group of acids, bars not labeled with same letters indicate values are significantly different at P < 0.05.
