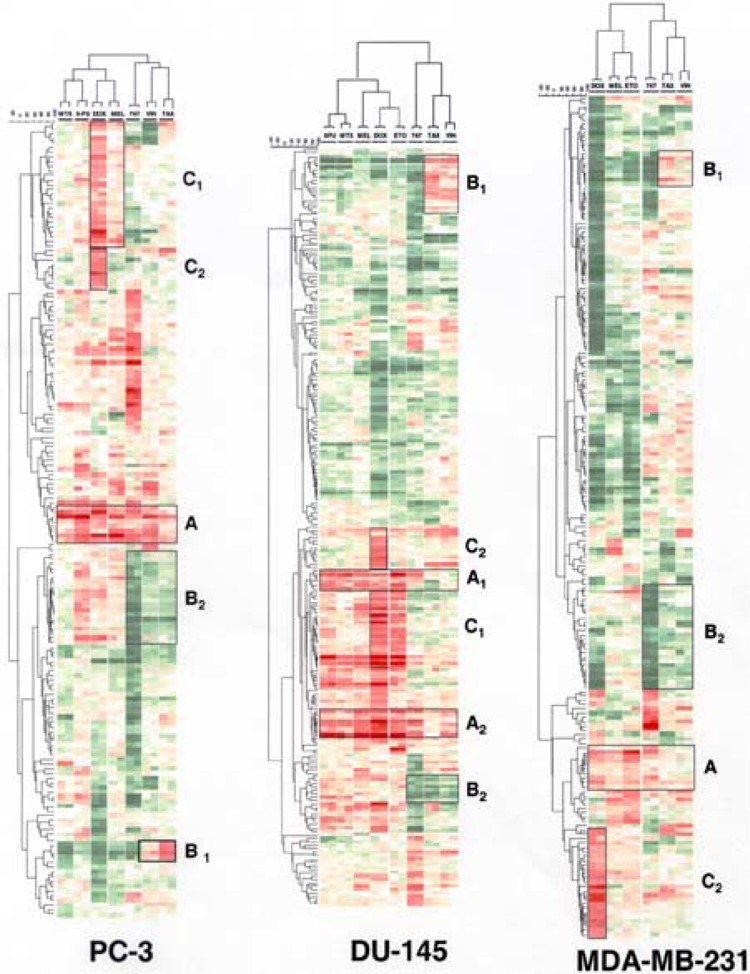
Figure 2.

Two-dimensional hierarchical cluster analysis of gene expression profiles following treatments with anticancer drugs. PC-3, DU-145, and MDA-MB-231 cells were treated for 24 h at doses described in Table 1. Unsupervised hierarchical clustering (GeneMaths software) was applied to the list of modulated genes as described in Materials and Methods. Increases in mRNA expression are indicated by shades of red while decreases are shown by shades of green. Cluster A: genes involved in the stress/apoptosis responses in PC-3 and MDA-MB-231; this cluster is divided into clusters A1 and A2 in DU-145. Cluster B1: spindle inhibitors biomarkers; genes involved in cell cycle progression and mitosis. Cluster B2: spindle inhibitors biomarkers; genes involved in replication process. Cluster C1: topoisomerase inhibitors biomarkers; genes involved in response to interferon. Cluster C2: doxorubicin biomarkers; doxorubicin-induced genes.
