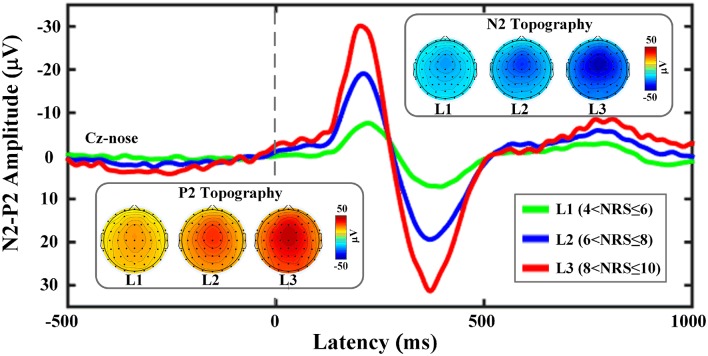
Figure 2.
Group averages and scalp topographies of LEP responses at different NRS levels. LEP waveforms were recorded from the vertex (Cz-nose). The group mean value for N2 peak is −7.58 ± 8.88 μV, −19.06 ± 12.72 μV and −30.13 ± 18.84 μV for three levels respectively. The group mean value for P2 peak is 7.14 ± 8.20 μV, 19.38 ± 11.98 μV and 31.34 ± 12.70 μV for three levels respectively. The scalp topographies of N2 and P2 waves are displayed at their peak latencies.

