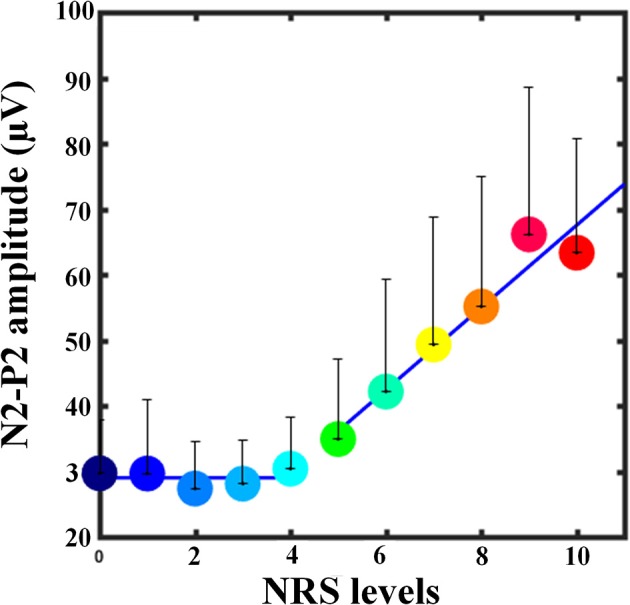
Figure 3.

Relationship between pain intensity and N2-P2 amplitude at Cz. Colored dots represent the N2-P2 amplitudes of fast-pain trials averaged across participants, and error bars denote the SD values across participants. The blue line represents the fitted linear model for low-pain trials and fast-pain trials separately. Note that, when NRS = 10, the N2-P2 amplitudes are slightly lower than those of NRS = 9. The possible reason is that only 18 participants had fast-pain trials of NRS = 10, which might make the estimation have large variance and not reliable.
