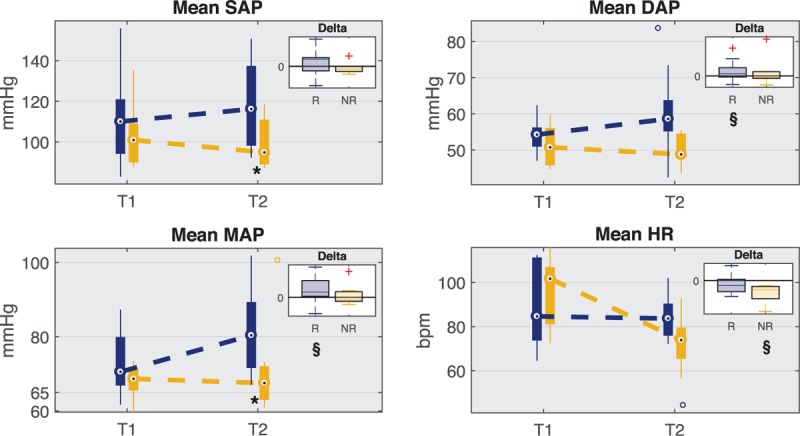
Fig. 3.
Boxplot distribution of mean values for systolic (SAP), diastolic (DAP), mean (MAP) arterial pressure, and heart rate (HR) at time points T1 and T2 for responder (R) and non-responder (NR) patients.

The upper right box displays the distribution of delta values computed as the difference between values at T2 and values at T1 for both groups. The horizontal black line marks the zero value that means no change from T1 to T2. ∗P < 0.05 Mann–Whitney U test between R and NR, §P < 0.05 Wilcoxon signed-rank test between T1 and T2.
