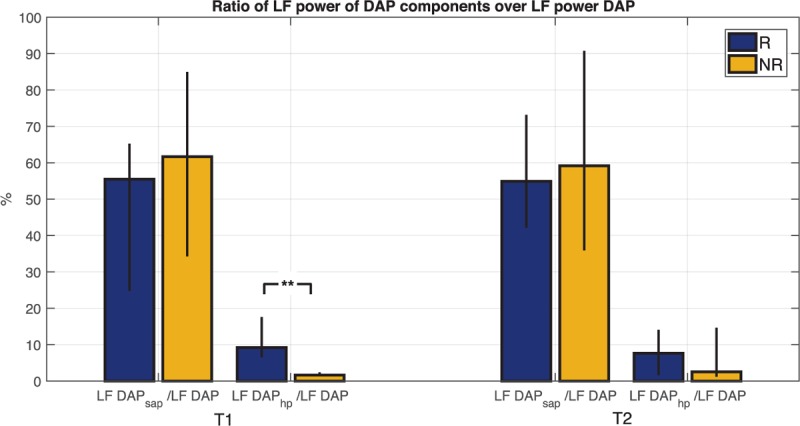
Fig. 6.
Ratio between LF absolute power of each predicted component and LF absolute power of diastolic blood pressure (DAP) at time points T1 and T2 for both groups of responder (R) and non-responder (NR) patients.

The height of the bar is the median value of the population; black bars indicate values of 25th and 75th percentile. ∗∗P < 0.01 Mann–Whitney U test between R and NR.
