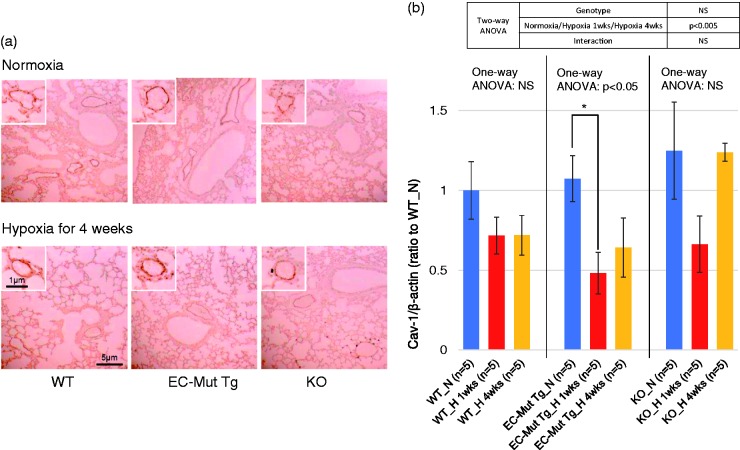
Fig. 5.
Cav-1 expression in lungs of EC-Mut Tg, KO, and WT mice exposed to hypoxia. (a) Representative images o.f lung immunohistochemistry for Cav-1 in EC-Mut Tg, KO, and WT mice under normoxia or hypoxia for four weeks. Similar results were obtained from three independent experiments. The small boxes showCav-1 immunostaining in pulmonary vascular ECs. The scale bars represent the indicated dimensions. (b) Quantified data of western blotting for Cav-1 levels in lungs of EC-Mut Tg, KO, and WT mice under normoxia (N), hypoxia for one week (H 1wks) and hypoxia for four weeks (H 4wks). Western blot images are shown in Fig. S3. β-actin was used as internal control. The values are relative intensities normalized to WT mice under normoxia (WT_N). Data with bars represent mean ± SEM. The number of experiments (n) is indicated in the figure. There were no significant differences among WT_N, EC-Mut Tg_N and KO_N by one-way ANOVA (P > 0.05). One-way ANOVA comparing Cav-1 levels among normoxia, hypoxia for one week and hypoxia for four weeks in each genotype shows that there were significant differences (P < 0.05) in EC-Mut Tg mice, but not in WT and KO mice. *P < 0.05, by Tukey’s post-hoc test compared with normoxia. NS, not significant.

