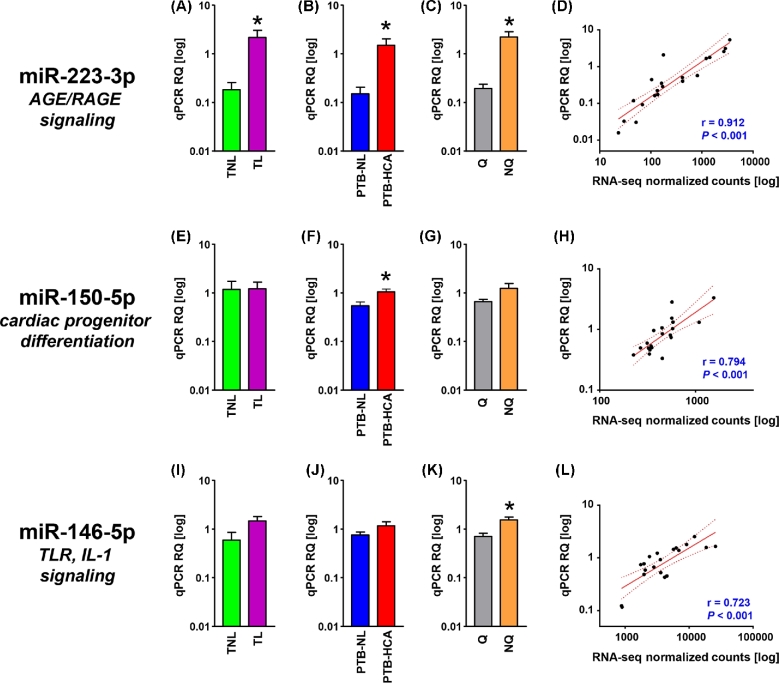
Figure 2.
Cross-validation of miRNA-seq data represented in the miRNA-PPI subnetworks. (A–C) Relative quantification (RQ) of real-time quantitative PCR (qPCR) data for mature miR-223-3p in term myometrial specimens (TNL, term nonlabor; TL, term labor; A), preterm myometrial specimens (PTB-NL, preterm birth nonlabor; PTB-HCA, preterm birth with histologic chorioamnionitis; B), and specimens grouped by molecular clustering (Q, quiescent phenotype; NQ, nonquiescent phenotype; C). (D) Scatterplot and linear regression analysis (line of best fit and 95% confidence interval) for miR-223-3p comparing qPCR results with normalized RNA-seq feature counts. (E–H) RQ (grouped as described above) and linear regression analysis (qPCR vs. normalized RNA-seq) for miR-150–5p. (I–L) RQ for mature Q (grouped as described above) and linear regression analysis (qPCR vs. normalized RNA-seq) for miR-146-5p. Data in bar graphs comprise mean ± SEM. Asterisks indicate P < 0.05 by Student t-test.

