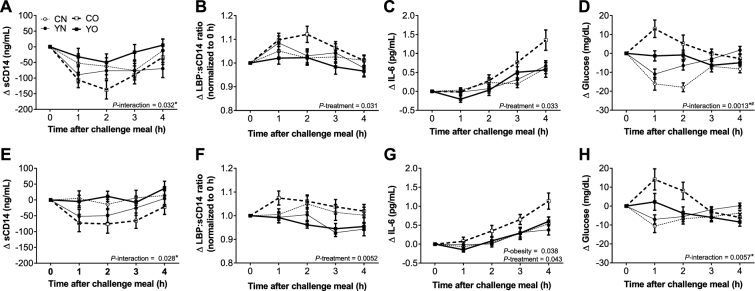
FIGURE 1.
Incremental postprandial changes in plasma sCD14 (A), LBP:sCD14 ratio (B), IL-6 (C), and glucose (D) at week 0 of the intervention and in plasma sCD14 (E), LBP:sCD14 ratio (F), IL-6 (G), and glucose (H) at week 9 of the intervention in healthy obese and nonobese premenopausal women who consumed low-fat yogurt or the control food followed by the challenge meal. Data are means ± SEMs, n = 30. The effects of obesity status (obese compared with nonobese), dietary treatment (low-fat yogurt compared with control food), and the obesity × treatment interaction on net iAUC were determined by 2-factor ANOVA (PROC GLM). A post hoc F test (sliceby) was applied when P-interaction was <0.05. *YO different from CO, P < 0.05. #YN different from CN, P < 0.05. CN, control nonobese; CO, control obese; iAUC, incremental AUC; LBP, LPS-binding protein; sCD14, soluble CD14; YN, yogurt nonobese; YO, yogurt obese; Δ, difference.

