
FIGURE 4.
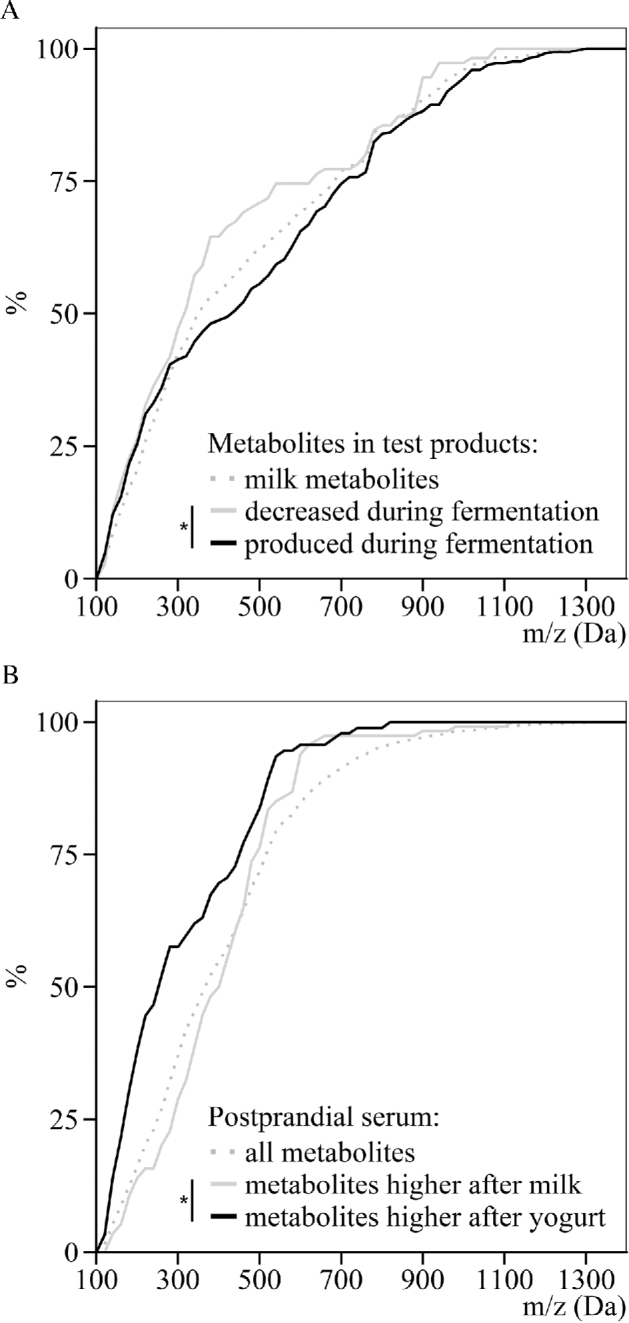
Differentiation of the size distribution of metabolites in dairy products and serum samples of healthy men after milk or yogurt intake through the use of untargeted LC-MS metabolomics. (A) Cumulative mass distribution of all milk metabolites, metabolites that decreased during fermentation, or metabolites that were produced during fermentation (OPLS-DA VIPtot > 1 or P < 0.05). (B) Cumulative mass distribution of all serum metabolites, metabolites with higher postprandial serum concentration after milk intake, or metabolites with higher postprandial serum concentration after yogurt intake (OPLS-DA VIPtot > 1 or P < 0.05). * P < 0.01, Kolmogorov-Smirnov test between the 2 indicated distributions. OPLS-DA, orthogonal projections to latent structures discriminant analysis; VIPtot, variable importance in projection for the predictive and orthogonal components.