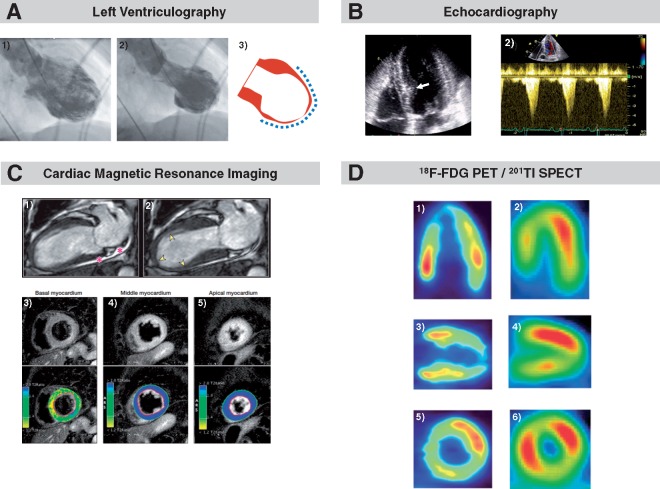
Figure 3.
Apical ballooning illustrated by different imaging modalities. Typical takotsubo type with apical ballooning pattern during diastole (A.1) and systole (A.2) on left ventriculography. Dashed lines indicate extent of wall motion abnormality (A.3). Modified and reprinted with permission from Templin et al.2 Apical four-chamber view obtained by echocardiography showing apical ballooning and left ventricular cavity with bulging of the basal interventricular septum (white arrow) (B.1). B.2 reveals left ventricular outflow tract obstruction by pulsed-wave Doppler interrogation. Modified and reprinted with permission from Merli et al.100 Apical ballooning as illustrated by cardiac magnetic resonance imaging. The asterisks indicate pericardial effusion (C.1) and yellow arrows (C.2) shows the region of akinesia. T2-weighted images on short-axis view demonstrates normal signal intensity of the basal myocardium (C.3) and global oedema of the mid and apical myocardium (C.4 and C.5). Modified and reprinted with permission from Eitel et al.82 Metabolic imaging with positron emission tomography and 18F-flurodeoxyglucose (D.1, D.3, D.5) demonstrates decreased uptake in the apex and midventricular segments. Perfusion imaging using single photon emission computed tomography with 201thallium chloride (D.2, D.4, D.6) shows a smaller perfusion defect in the apex and midventricular segments. Reprinted with permission from Yoshida et al.98

