Figure 2.
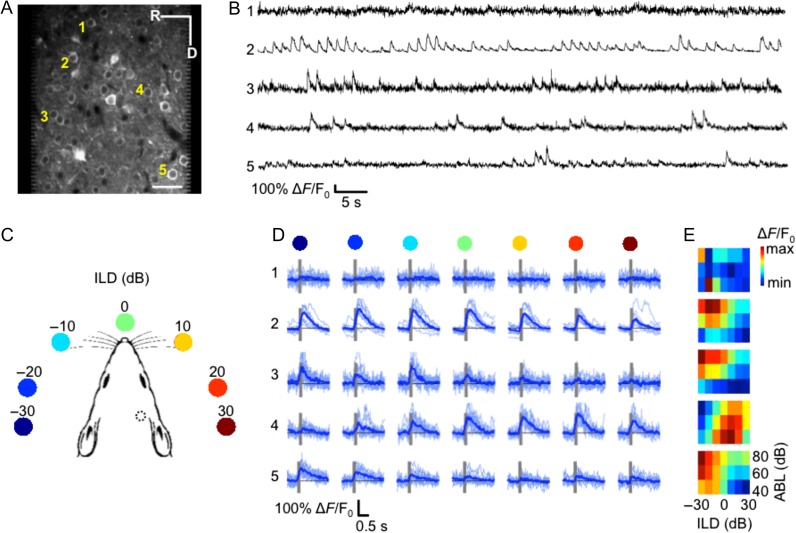
ILD sensitivity in mouse auditory cortex demonstrated using in vivo 2-photon calcium imaging of GCaMP6m. (A) An example imaging area at 290 μm below the pial surface. Scale bar is 50 μm. (B) The lines plot the relative changes in fluorescence of the 5 neurons indicated in (A) during presentation of noise bursts. (C) Cartoon representation of auditory stimuli: 7 ILDs ranging from −30 to 30 dB ILD in 10 dB steps were presented to the mouse during the imaging session via calibrated speakers coupled to the ears via tubes inserted into the ear canals. The position of the colored dots indicates the approximate corresponding azimuthal angle relative to the mouse head based on acoustical measurements by Chen et al. (1995). Monaural stimuli were also presented to each ear (not shown). The dotted circle indicates the position of our cranial window for imaging. (D) Each row shows the individual (light blue) and mean (dark blue) ∆F/F0 values of the same 5 neurons from (A,B) in response to each of the 7 ILD values, for noise bursts presented at 60 dB ABL. Gray bars indicate stimulus presentation time. The colored dots from (C) are shown above each column for reference. (E) ILD response area plots for each of the 5 neurons shown in (A,B,D). The color scale indicates the trial-averaged response of the neuron to each of the 7 ILDs (x-axis) presented at each of 3 ABLs (rows). R, rostral; D, dorsal.

