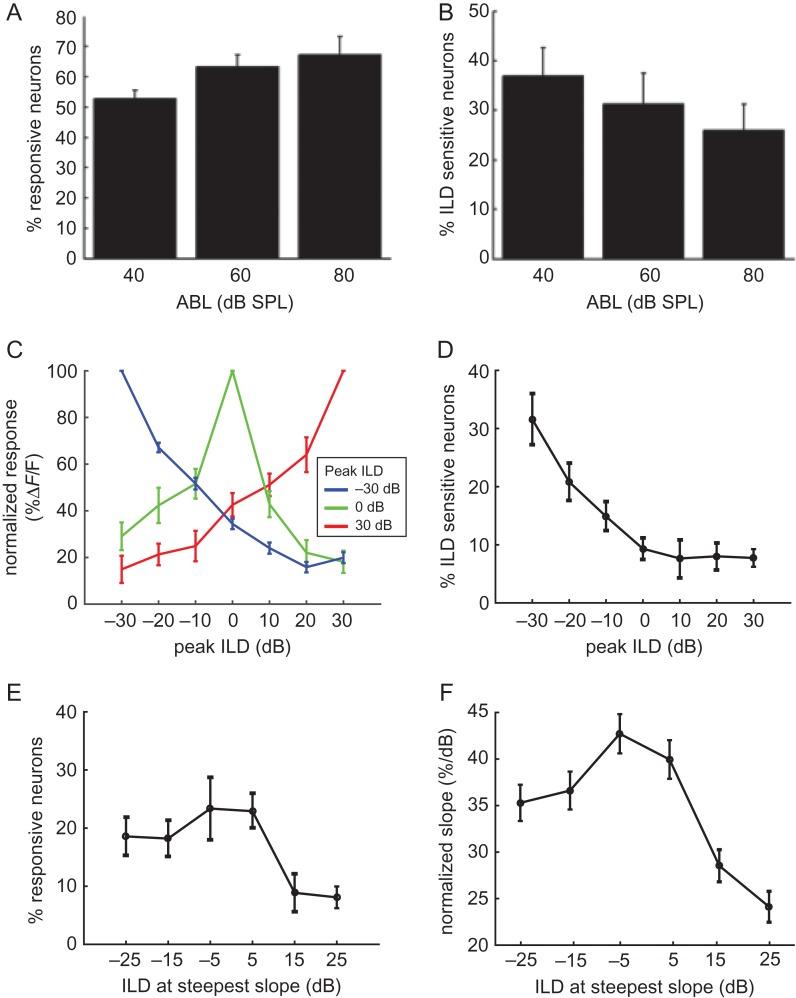
Figure 3.
The majority of ILD-sensitive neurons prefer broadband stimuli favoring the contralateral ear. (A) Mean percentages of neurons responsive to sound stimulation (t-test; P < 0.01) across mice at each of the ABLs tested. (B) Mean percentages of neurons showing ILD sensitivity (ANOVA; P < 0.05) across mice. (C) Average normalized ILD response functions for all neurons responding maximally to ILDs of −30 (blue), 0 (green) or 30 dB (red) (data obtained from responses at 60 dB ABL). (D) Mean percentages of neurons preferring different ILD values at 60 dB ABL across all mice injected with GCaMP6m. (E) Mean position of the steepest ILD response function slopes at 60 dB ABL. (F) Variation in mean ILD response function slope, normalized across all the noise-responsive neurons, with ILD. All error-bars indicate standard errors.

