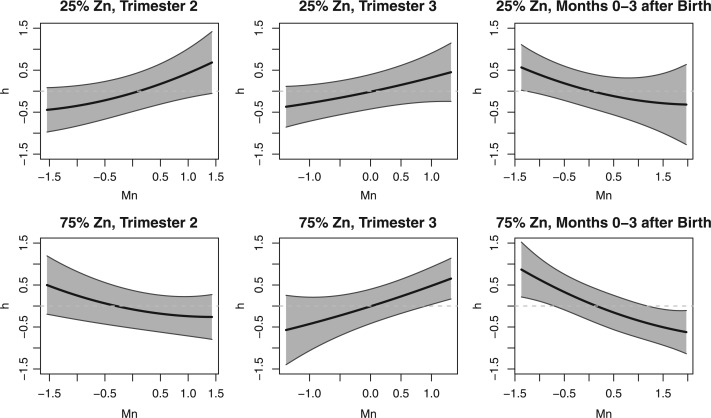
Fig. 3.
LKMR estimated time-specific exposure-response functions for Mn at low and high Zn levels applied to ELEMENT data. Plot of the cross-section of the estimated exposure-response surface for Mn, at the 25th (top panel) and 75th (bottom panel) of Zn exposure, holding Ba, Cr, and Li constant at median exposures.

