Figure 2.

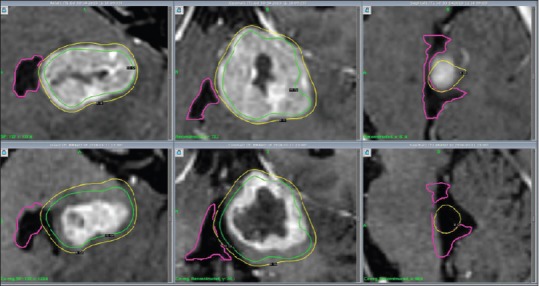
Patient 2, MRI (CE 3D T1): Axial, coronal and sagittal cross-sections (left to right) illustrate decreasing tumour volume and V4 decompression from GKRS 1 (above) to second follow up 8 weeks after GKRS 3 (below)

Patient 2, MRI (CE 3D T1): Axial, coronal and sagittal cross-sections (left to right) illustrate decreasing tumour volume and V4 decompression from GKRS 1 (above) to second follow up 8 weeks after GKRS 3 (below)