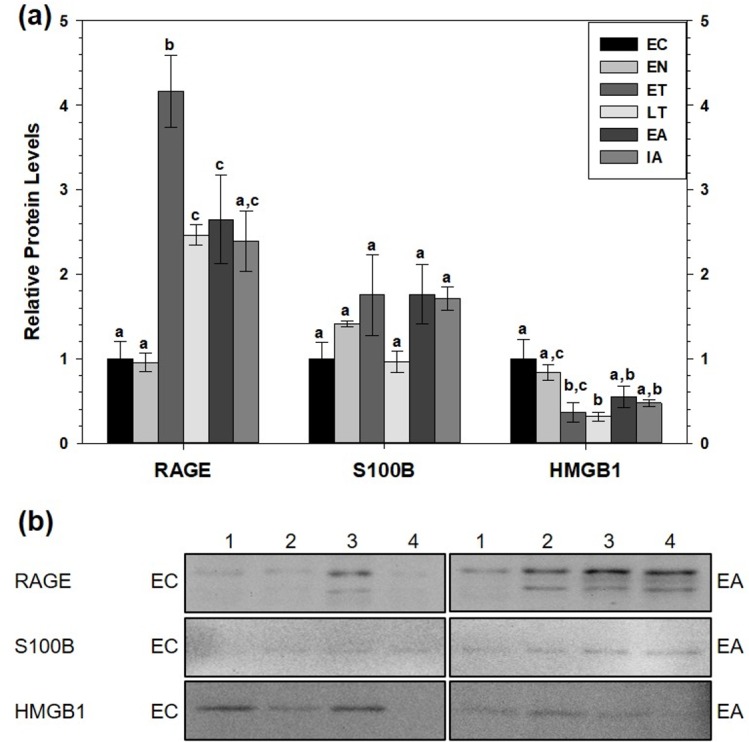
Figure 3. Relative total protein levels of RAGE andligands S100B and HMGB1 in white adipose tissue (WAT) of 13-lined groundsquirrels.

(A) Histogram showing relative mean protein levels of RAGE, S100B, and HMGB1 (± S.E.M., n = 4 independent protein isolations from different animals). (B) Representative western blots for certain torpor-arousal time points. A space between representative band images indicates a removal of other lanes from the same blot. Data were analyzed using ANOVA with Tukey’s post-hoc test. Shared letters indicate data are not significantly different from each other and different letters indicate statistical significant differences between sample points (p < 0.05).
