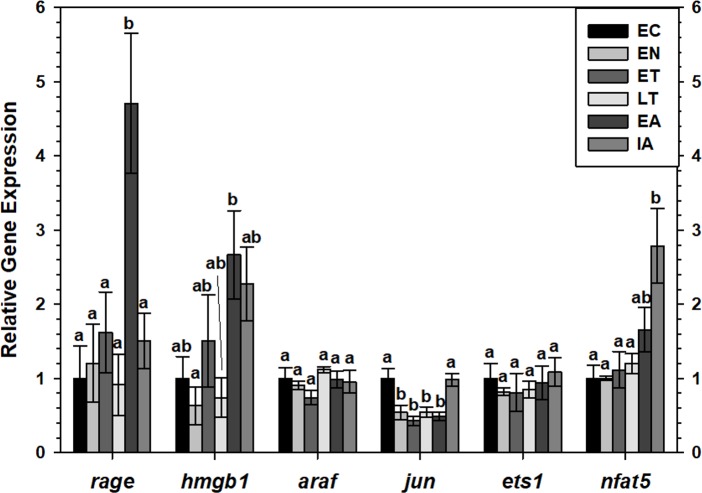
Figure 5. Expression of mRNAs in BAT samples wasevaluated by RT-qPCR for 6 time points over the torpor-arousal cycle.
Relative expression of mRNAs was normalized to the expression of TATA-binding protein (tbp) mRNA from the same sample. The relative mRNA expression in the torpid animals was normalized to the euthermic control. Data are mean ± SEM (n = 4 independent trials from different animals). Data were analyzed using a one-way ANOVA with Tukey’s post-hoc test. Shared letters indicate data that are not significantly different from each other and different letters indicate statistical significant differences between sample points (p < 0.05).

