
Figure 7. Hibernating 13-lined ground squirrelsdifferentially regulate RAGE and downstream ERK1/2 signaling pathway proteinsin white and brown adipose tissues.
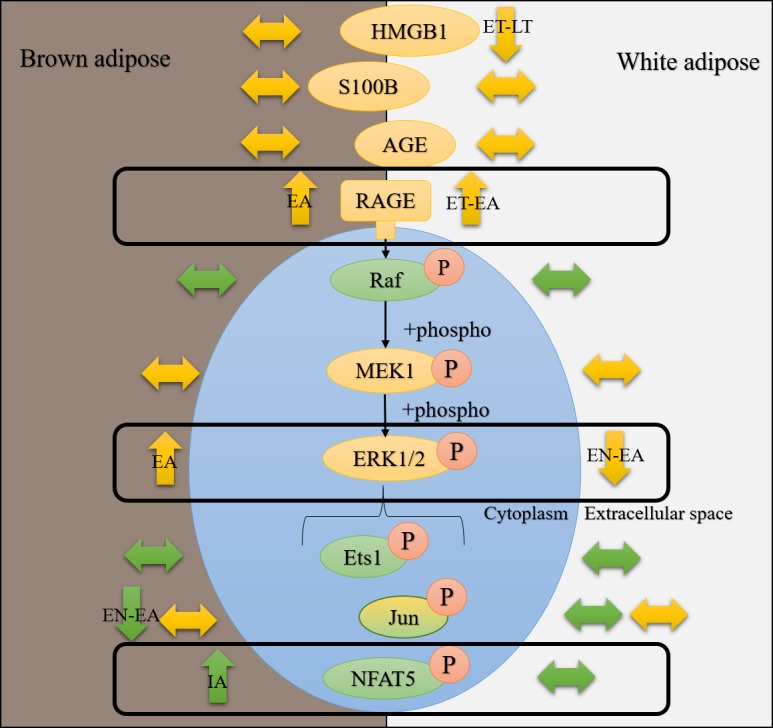
Data from the current study and the study by Rouble, Tessier & Storey (2014) were used to generate this figure. Green bubbles represent mRNAs and yellow bubbles denote proteins unless accompanied by an orange “P”, which indicates that data for phosphorylation of this protein is being considered. Arrows pointing up, down, or sideways denote increases, decreases, or no change (respectively) in mRNA, protein, or phosphorylation levels. Time course time points where the changes are observed are indicated in black text on top of the arrows describing the direction of the change.