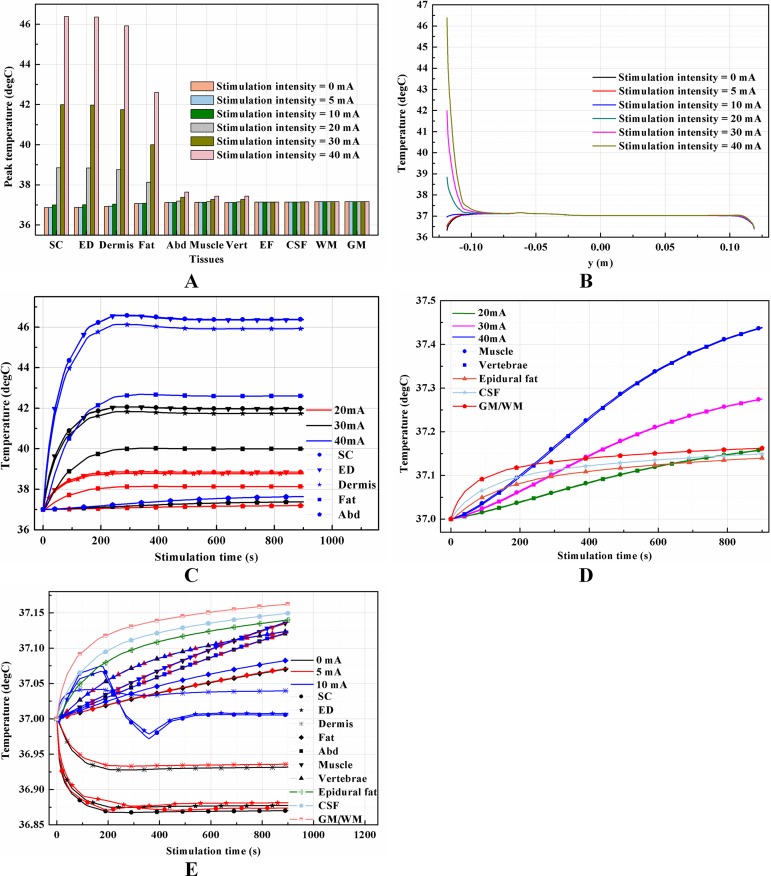
Figure 12. Effects of the stimulation intensity on the thermal status during tSCS.
(A) The peak temperature of each tissue type at the end of the electrical stimulation with different stimulation intensities. (B) Temperature distribution along the reference line at the end of tSCS. (C–D) Temperature rising curves of the points with peak temperature variance for each tissue type for stimulation intensity of 20, 30, and 40 mA. (E) Temperature rising curves of the points with peak temperature variance for each tissue type for stimulation intensity of 0, 5, and 10 mA. The stimulation electrode side length is 1 cm, and the blood perfusion rate of the dermis and WM/GM are 0.025 and 0.012 s−1, respectively.

