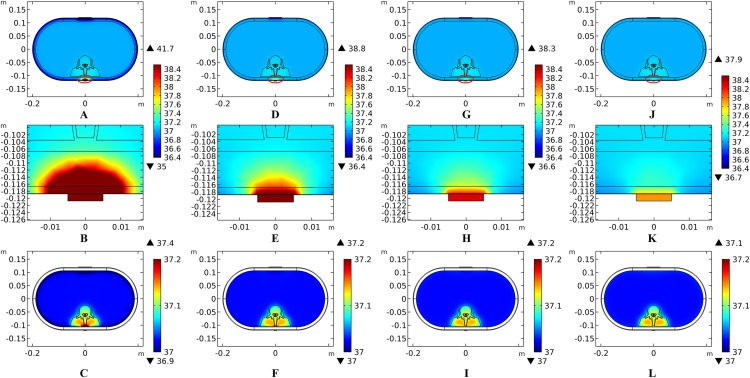
Figure 6. Temperature distribution at the end of stimulation for varied blood perfusion rate of the dermis layer.
(A–C) The blood perfusion rate of the dermis is 0 s−1. (D–F) The blood perfusion rate of the dermis is 0.025 s−1. (G–I) The blood perfusion rate of the dermis is 0.05 s−1. (J–L) The blood perfusion rate of the dermis is 0.1 s−1. (A, D, G, J) The temperature distribution on the cross-sectional surface for different perfusion rate of the dermis layer. (B, E, H, K) The magnified view of the hot area, i.e. the skin and fat layers (circled in (A, D, G, J) respectively). (C, F, I, L) The temperature distribution of the abdomen, muscles and the vertebrae. The stimulation intensity is 20 mA, the stimulation electrode side length is 1 cm, and the blood perfusion rate of the WM/GM is 0.012 s−1. The maximum and minimum temperature values are shown with the corresponding color bars in each panel. Unit: °C.

