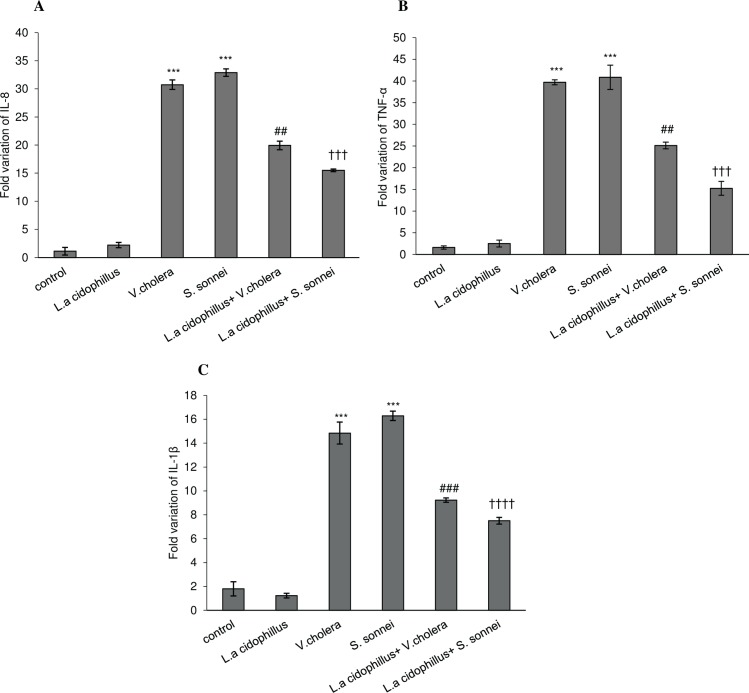
Fig 4. Expression of selected genes (IL-8. TNF-α and IL-1β) was determined by real-time quantitative polymerase chain reaction analysis in experimental cell groups.
The fold-changes in expression of (A)IL-8, (B)TNF-α and (C)IL-1β after treatment by L. acidophilus was normalized to GAPDH and compared in infected and uninfected Caco-2 cells. The fold-changes in genes expression were represented from at least 3 independent experiments. The statistical results were remarkable when P <0.05. (***P <0.001) significantly different from control cells. ## or ### significant difference between L.a+V.c+Caco-2 and V.c+Caco-2 cells. ††† or †††† significant difference between L.a+S.s+Caco-2 and S.s+Caco-2 cells L.a: Lactobacillus acidophilus, V.c: Vibrio cholerae and S.s: Shigella sonnei.

