
FIGURE 3.
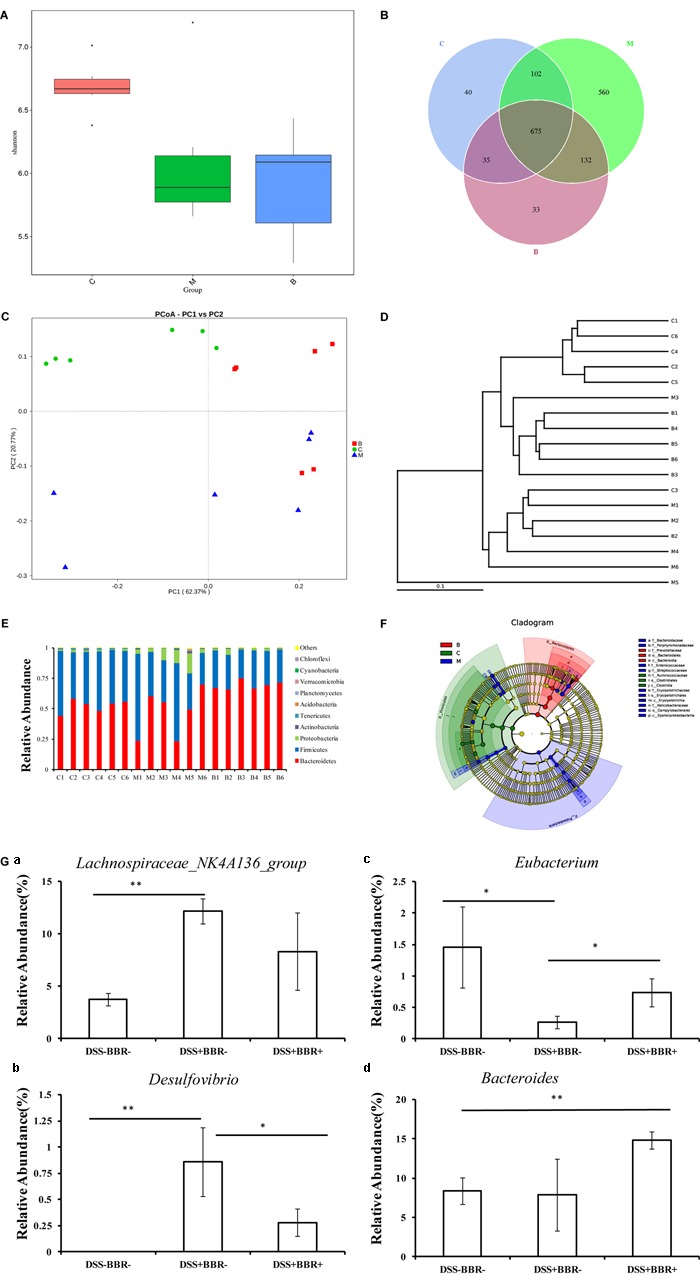
Berberine changed the structure of gut microbiota in UC model mice. (A) Shannon index calculated after rarefying to an equal number of sequence reads for all samples, the Shannon indexes were decreased after DSS and BBR treatment; (B) Venn diagram indicated the differential numbers of OTUs in each group; (C) PCoA score based on weighted Unifrac metrics was different in each group; (D) System clustering tree of gut microbiota based on weighted Unifrac metrics indicated the different beta diversity of gut microbiota in each group; (E) BBR treatment changed the microbial community in phylum level (bar plot); (F) Cladogram of gut microbiota in each group indicated the predominant microbiota in DSS+BBR+ group was Bacteroidetes; (G) The relative abundance of Lachnospiraceae_NK4A136_group (a) was increased in DSS+BBR– group compared with DSS–BBR– group whereas BBR treatment decreased the relative abundance of Desulfovibrio (b) and increased the relative abundance of Eubacterium (c) compared with DSS+BBR– group. Moreover, the relative abundance of Bacteroides (d) was increased in DSS+BBR+ group compared with DSS–BBR– group. C: DSS–BBR– group (n = 6). M: DSS+BBR– group (n = 6). B: DSS+BBR+ group (n = 6). Data are presented as mean ± SD. ∗p < 0.05, ∗∗p < 0.01.